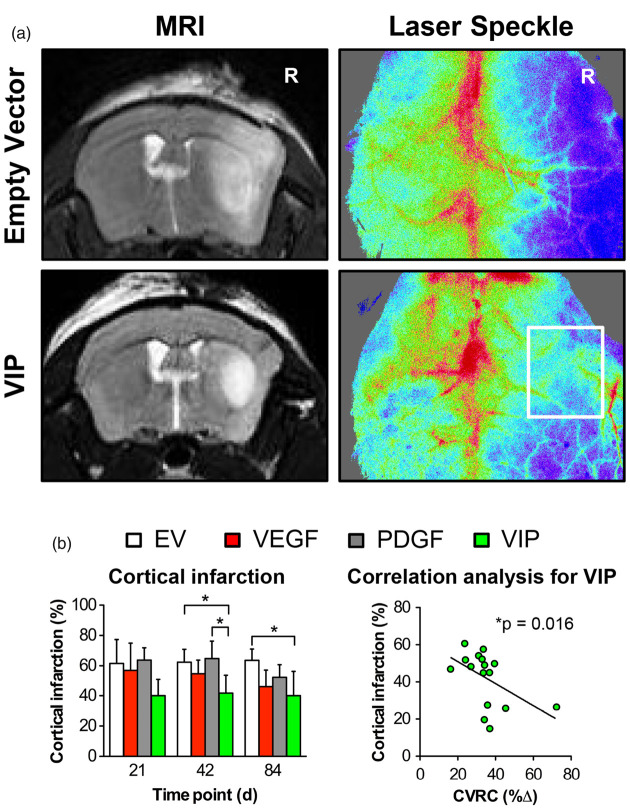
Figure 3.
Cortical stroke and regional perfusion following MCA-O. (a) T2-weighted MR (left) and laser speckle (right) images illustrating the differences in T2 signal hyperintensity (defined as infarction) and perfusion after ipsilateral MCA-O on day 42 in animals treated with EV (upper panels) and VIP (lower panels) myoblasts. R: right. (b) Bar graph illustrating the percentage of cortical infarction (*p<0.05) determined in MR imaging and correlation analysis confirming the significant association between the size of the infarction and the degree of hemodynamic impairment in VIP-treated animals (*p = 0.016; r = −0.59).
EV: empty vector; VEGF: vascular endothelial growth factor; PDGF: platelet-derived growth factor; CVRC: cerebrovascular reserve capacity; CBF: cerebral blood flow.

