Figure 4.
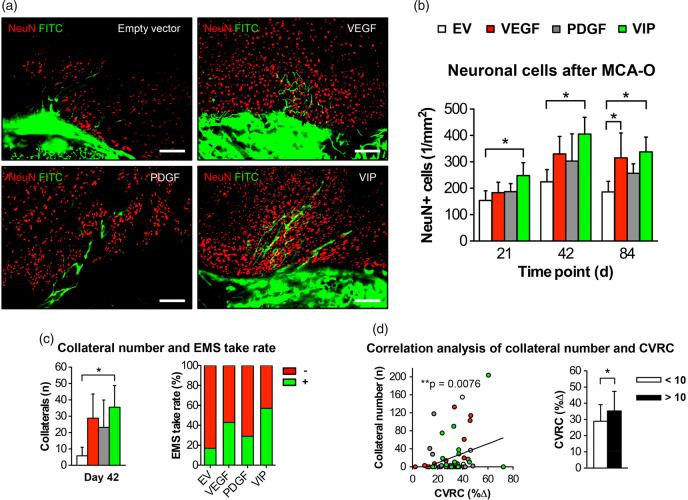
Neuroprotection after MCA-O and transpial collateralization. (a) Photomicrographs of the muscle/brain interface after MCA-O and FITC-lectin perfusion on day 42 illustrating the higher number of surviving neuronal cells post stroke together with the increased EMS collateralization measured as the number of transpial collaterals in VIP-treated animals. Bar = 100 µm. (b) Bar graph illustrating the number of NeuN-positive cells in the cortical region below the EMS (*p<0.05) and (c) showing the corresponding number of transpial collaterals (left) and the EMS take-rate (right) determined by FITC-lectin perfusion through the external carotid artery feeding the EMS after ipsilateral MCA-O; *p<0.05. (d) Correlation analysis between the degree of hemodynamic impairment and the number of transpial collaterals on day 42 (**p = 0.0076; r = 0.29). The bar graph illustrates the CVRC depending on the number of collaterals; *p<0.05.
EV: empty vector; VEGF: vascular endothelial growth factor; PDGF: platelet-derived growth factor; CVRC: cerebrovascular reserve capacity; CBF: cerebral blood flow; FITC: fluorescein isothiocyanate; EMS: encephalomyosynangiosis; MCA-O: middle cerebral artery-occlusion.

