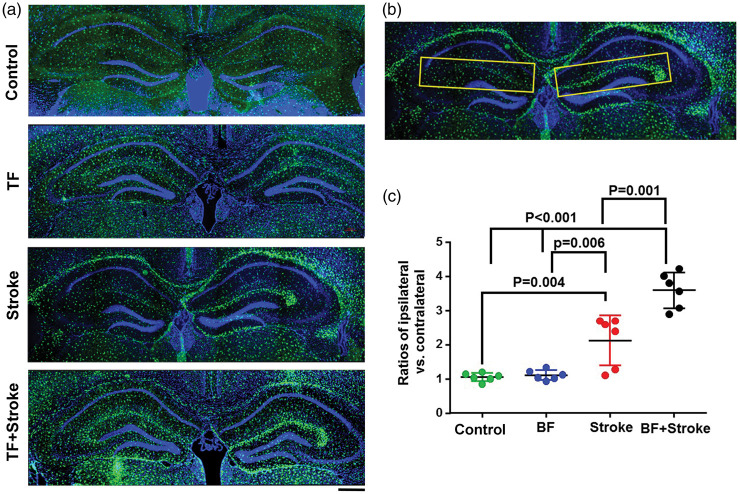
Figure 3.
More Cx3cr1+ cells in the hippocampal SLMs region ipsilateral to stroke injury in stroke- and BF+stroke-groups. (a) Representative microscopic images. Microglia express GFP (green). The nuclei were counterstained by DAPI (blue). Scale bar: 400 µm. (b) The areas in yellow boxes were used for quantifying Cx3cr1+ cells. (c) The ratios of Cx3cr1+ cells in SLMs of the ipsilateral verse contralateral sides of stroke injury. n = 6.

