Figure 2.
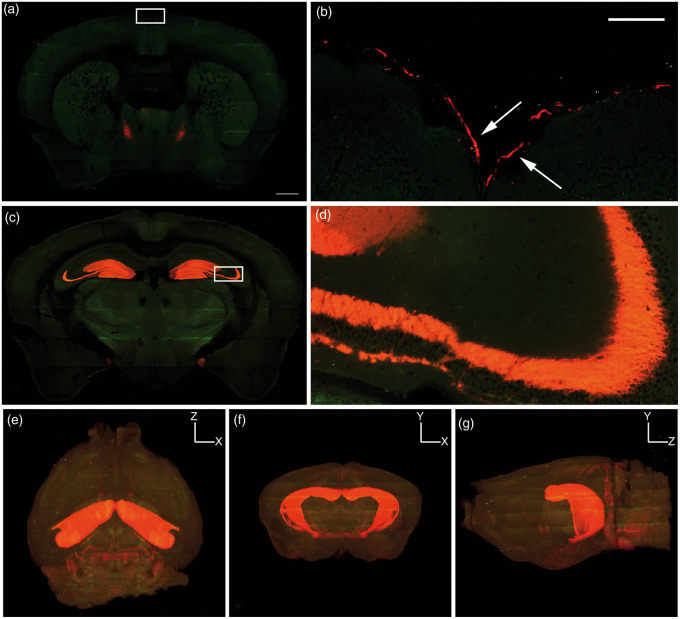
3D imaging of cortical Prox-1 expression. TissueCyte serial two-photon tomography of Prox1-tdTomato (red) fluorescence shows (a–b) meningeal lymphatic expression of Prox1 near the sagittal sinus (white arrows in box enlarged from (a)) and (c–d) cytoplasmic expression within the hippocampus, with inset in (c) (white box) enlarged in (d). (e–g) 3D renderings demonstrate predominantly hippocampal cytoplasmic colocalization and no intraparenchymal lymphatic vessels. (e) Dorsal, (f) coronal and (g) sagittal views of the brain. (a,c) scale bar is 500 µm; (b,d) scale bar is 100 µm. The green color in the panels is tissue autofluorescence.

