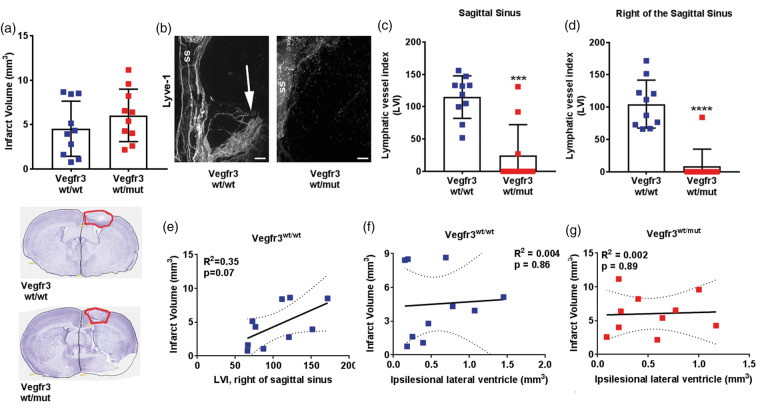
Figure 6.
Photothrombosis-induced meningeal lymphangiogenesis correlates to severity of injury. (a) Quantification of infarct volumes of Vegfr3wt/wt (blue squares) and Vegfr3wt/mut (red squares) two weeks following PT (n = 10 per group, p = 0.18). Insets below graph show representative cresyl violet-stained cortical sections with infarcts highlighted in red. (b) Representative images of Lyve-1 + LVs at the sagittal sinus (ss) and right of the sagittal sinus (white arrow). (c) Quantification of meningeal LVs at the sagittal sinus and (d) to the right of the sagittal sinus of Vegfr3wt/wt and Vegfr3wt/mut (n = 10 per group). (e) Lymphangiogenesis correlates with increased infarct volume in Vegfr3wt/wt mice. (f,g) Linear regression of ipsilesional lateral ventricle volumes to infarct volume two weeks following PT shows no correlation in (f) Vegfr3wt/wt mice (R2 = 0.004) or (G) Vegr3wt/mut (R2 = 0.002). Meningeal LVI and infarct volumes were analyzed using a Mann–Whitney test or linear regression. All data presented as mean ± SD. ***p < 0.001, ****p < 0.0001. Scale bar = 200 µm.

