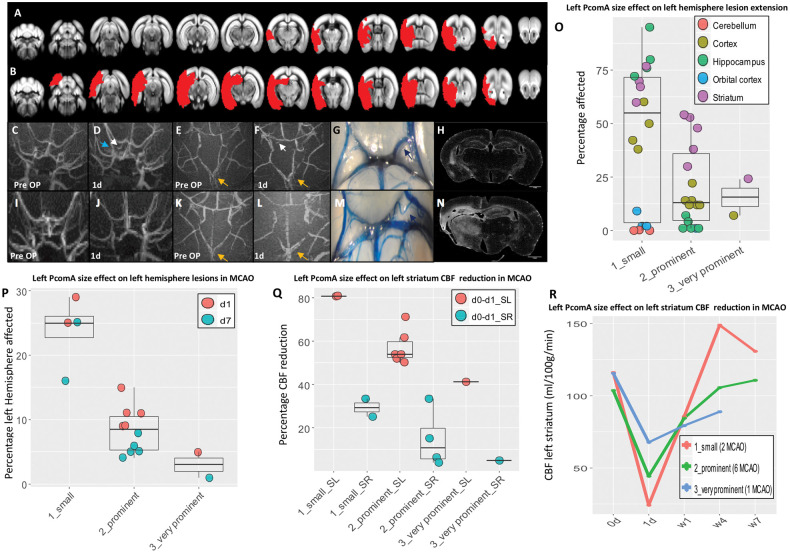
Figure 3.
Effect of PcomA in MCAO. (A–B) ischemic lesions (red shades) identified on T2-weighted MRI. (A–N) Edges of the phenotypic spectrum observed in MCAO mice: small lesion (A) associated to very prominent left PcomA (C–G) and absence of macroscopic left atrophy (H). (C–D) Recruitment of left PcomA is identifiable on MRA one day post-surgery (white arrow) and it is accompanied by increased intensity of left PCA (blue arrow). (B) Extensive lesion caused by small left PcomA (I-M), leading to significant left brain atrophy (N). (E–F) and (K–L) progressive increase in the AcomA size (yellow arrows). (O–R) PcomA size is the most important factor in determining lesion volume during acute hypoperfusion (one day), infarct resolution during subacute hypoperfusion (seven days) (O, P, Q), ipsilateral and compensatory contralateral CBF decay in ventral ischemic regions such as striatum (Q, R). Detailed description of MCAO mice phenotype as well as collateral blood flow direction is provided in the supplementary materials. Small, prominent and very prominent refer to the left PcomA size. SL: striatum left; SR: striatum right; d: day/s; w:weeks.

