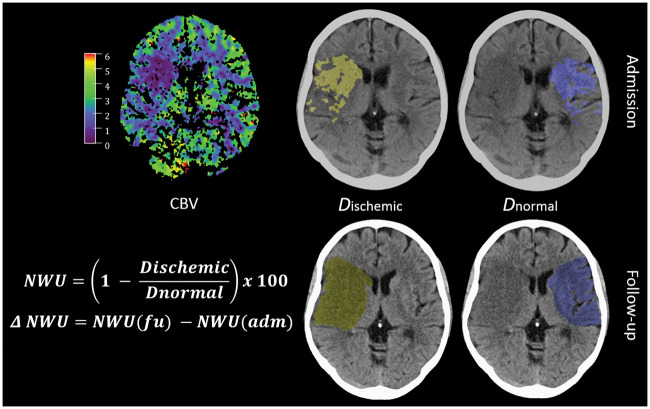
Figure 1.
Quantification of NWU. Quantification of NWU as recently published.12,17,18 NWU is determined in admission computed tomography (CT) using CBV parameter maps as template for region of interest definition in the non-enhanced CT (upper images). NWU in follow-up CT is quantified in non-enhanced CT (lower images) and its difference to admission CT is calculated (ΔNWU). NWU: net water uptake; CBV: cerebral blood volume.

