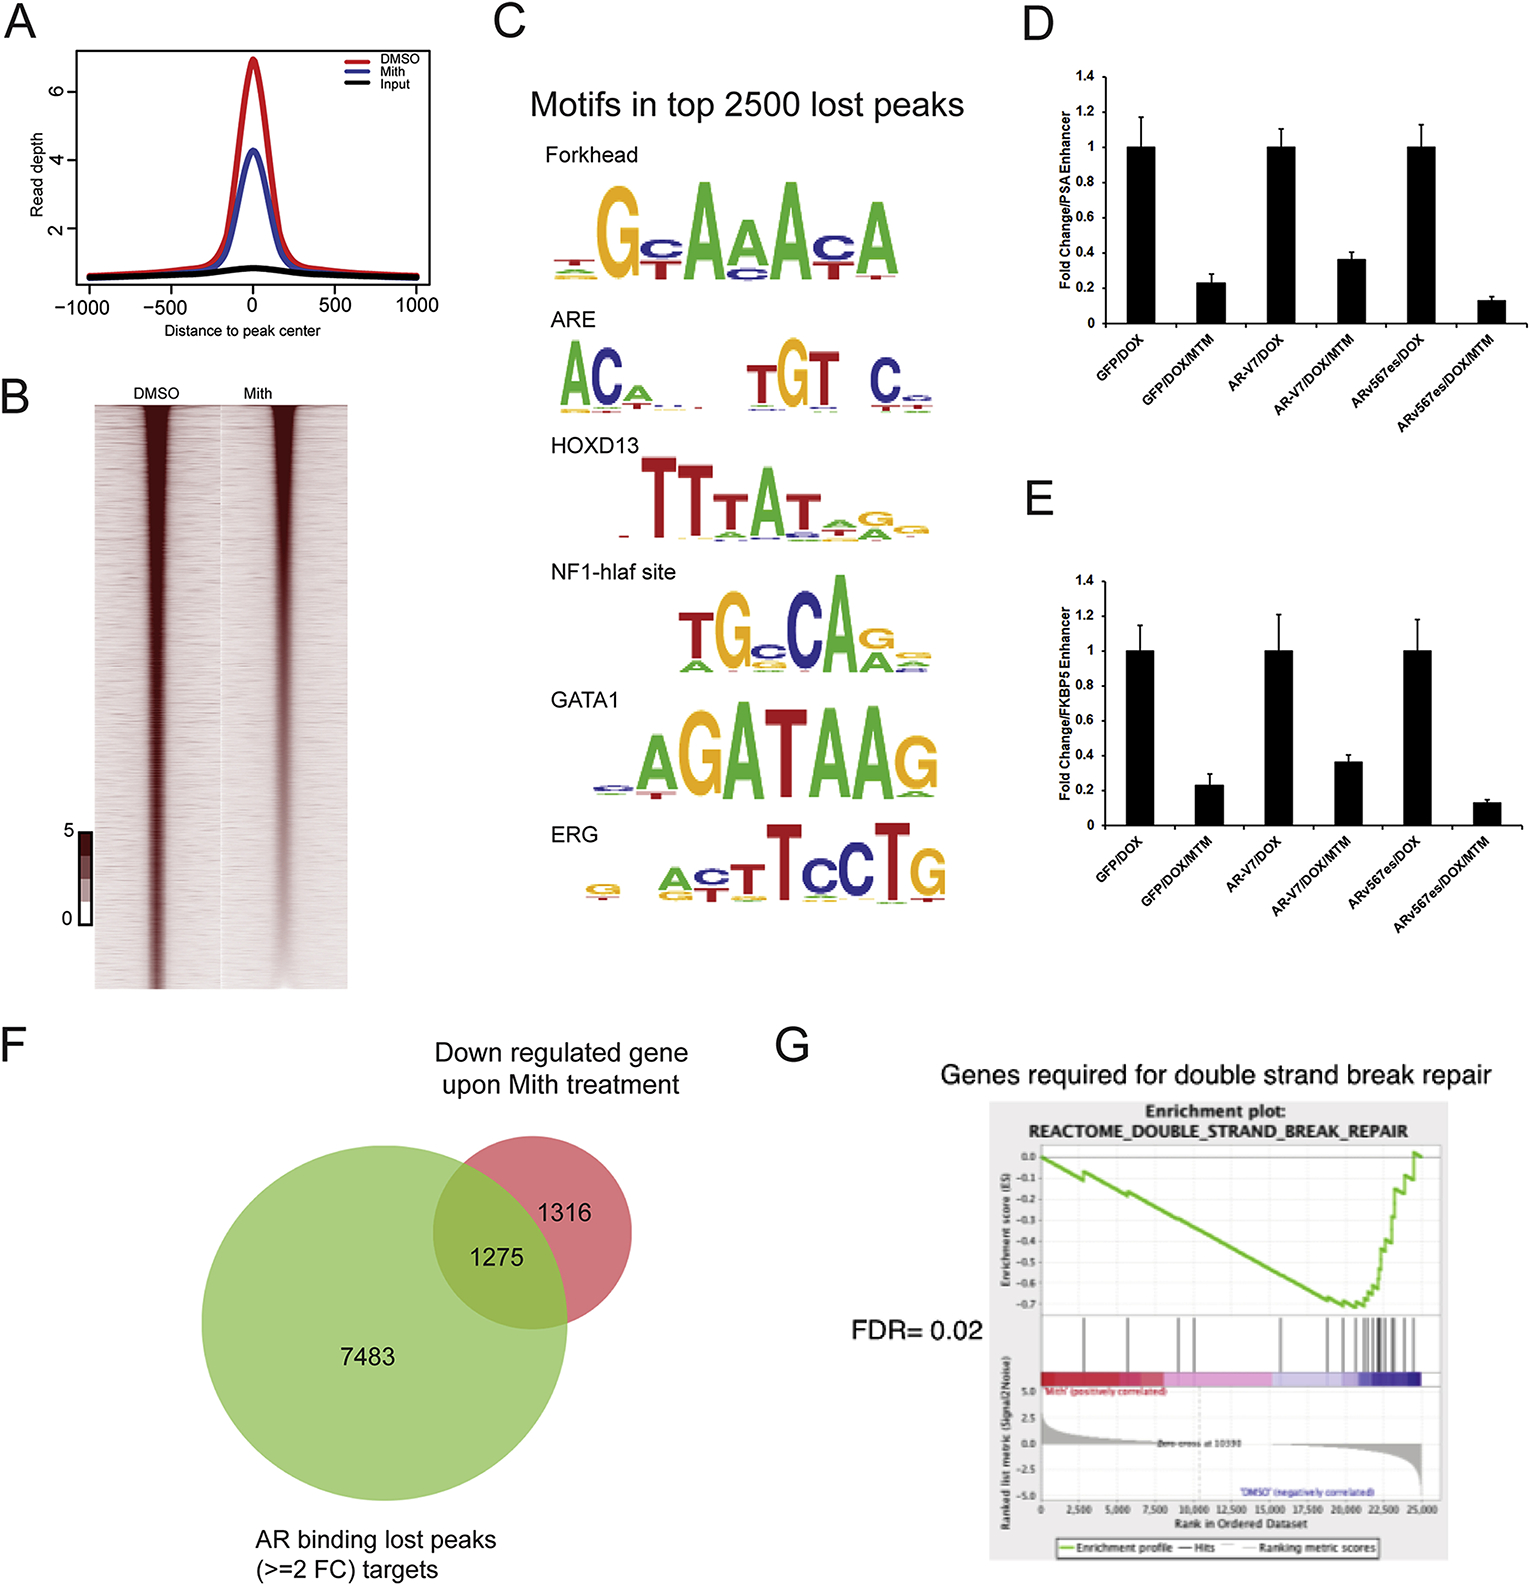
Fig. 2.

MTM weakens the transcription activity of AR in PCa. A, Density plots of ChIP-seq reads for AR occupied regions in VCaP cells with MTM treatment. The x-axis shows 2 kb 5′ and 3′ to the predicted peak summits. The y-axis depicts read depth in ChIP-seq. B, Heat map of ChIP-seq signals around AR peak in VCaP cells with MTM treatment. C, A list of the lost gene motifs in AR bound regions under MTM treatment. D, Fold change of ChIP-qPCR of PSA enhancer in LNCaP/GFP, LNCaP/AR-V7 and LNCaP/ARv567es cells with MTM treatment. E, Fold change of ChIP-qPCR of FKBP5 enhancer in LNCaP/GFP, LNCaP/AR-V7 and LNCaP/ARv567es cells with MTM treatment. F, Venn diagram representing AR binding lost peaks (≥2 Folds change) and downregulated genes upon MTM treatment in VCaP cells. G, GSEA of double strand break repair in VCaP cells with MTM treatment.
