FIGURE 2.

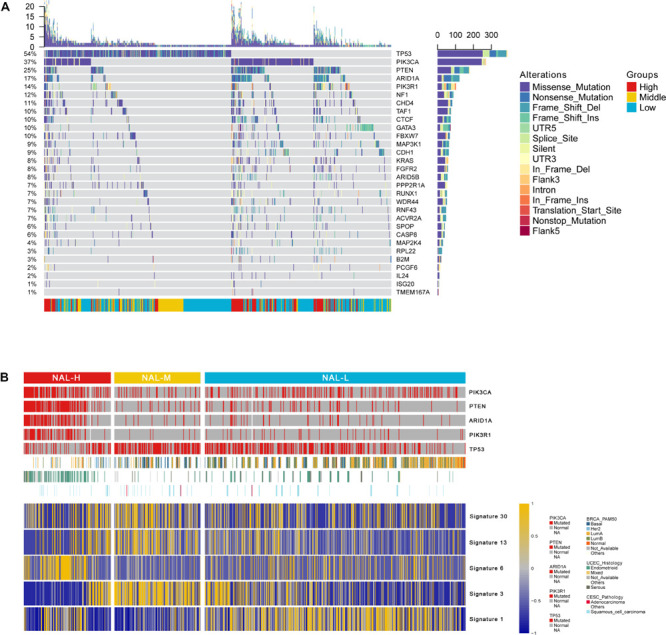
(A) Oncoprint shows the somatic mutation landscape of MutSigCV detecting differentially mutated genes among the subgroups. (B) Heat map of the differential mutation signatures among the subgroups.

(A) Oncoprint shows the somatic mutation landscape of MutSigCV detecting differentially mutated genes among the subgroups. (B) Heat map of the differential mutation signatures among the subgroups.