
FIGURE 2.
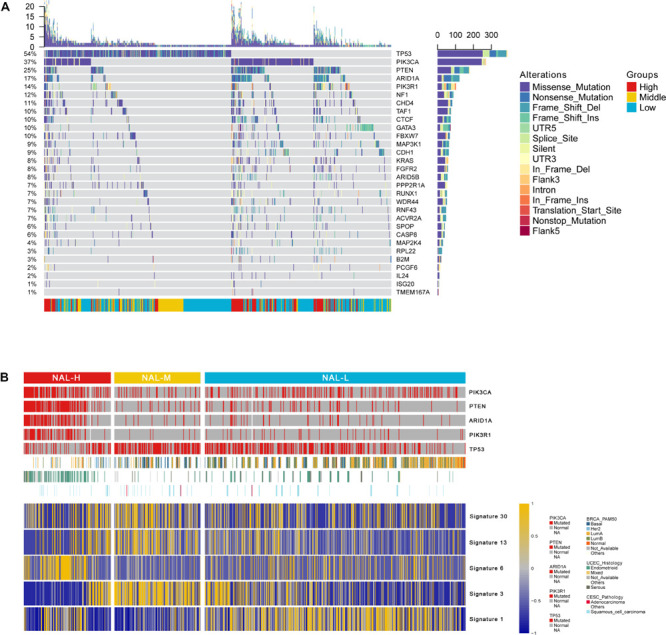
(A) Oncoprint shows the somatic mutation landscape of MutSigCV detecting differentially mutated genes among the subgroups. (B) Heat map of the differential mutation signatures among the subgroups.
Official websites use .gov
A
.gov website belongs to an official
government organization in the United States.
Secure .gov websites use HTTPS
A lock (
) or https:// means you've safely
connected to the .gov website. Share sensitive
information only on official, secure websites.
(A) Oncoprint shows the somatic mutation landscape of MutSigCV detecting differentially mutated genes among the subgroups. (B) Heat map of the differential mutation signatures among the subgroups.