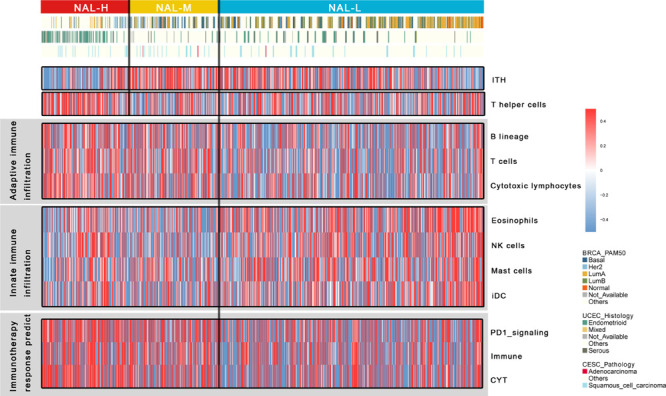
FIGURE 4.

Heat map of gynecologic cancers’ immune infiltrate state. High and low enrichment scores are presented in red and blue, respectively.

Heat map of gynecologic cancers’ immune infiltrate state. High and low enrichment scores are presented in red and blue, respectively.