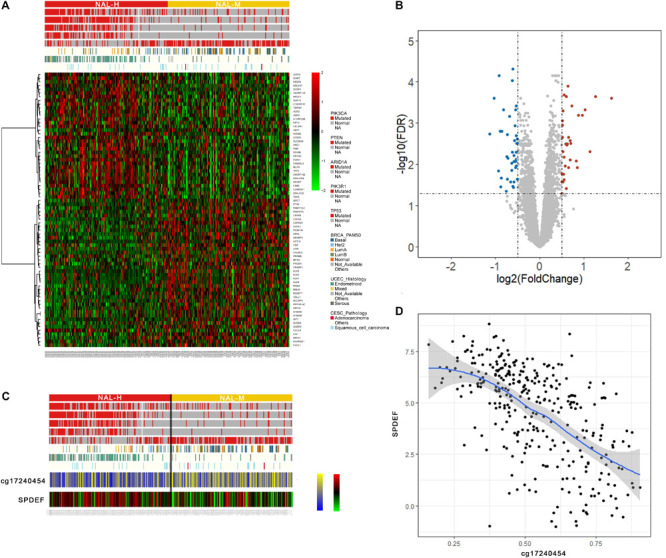
FIGURE 5.

(A) Heat map of the differentially expressed genes between the neoantigen load—high (NAL-H) and neoantigen load—medium (NAL-M). (B) The volcano plot shows the differential genes between groups. (C) Heat map of a gene of interest and its highly related methylation probe. (D) Correlation of a gene of interest and its highly related methylation probe.
