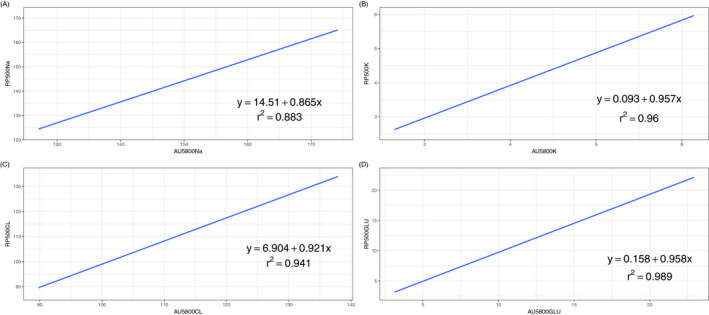
Figure 3.

Linear regression of Sodium (A), Potassium (B), Chloride (C), and Glucose (D) between arterial blood samples by RAPIDPOINT 500 and arterial plasma samples by AU5800. The Blue line indicates the linear model established and grey area nearby is the 95% CI. The linear equation and Pearson's coefficient were demonstrated in the figure
