
Figure 3.
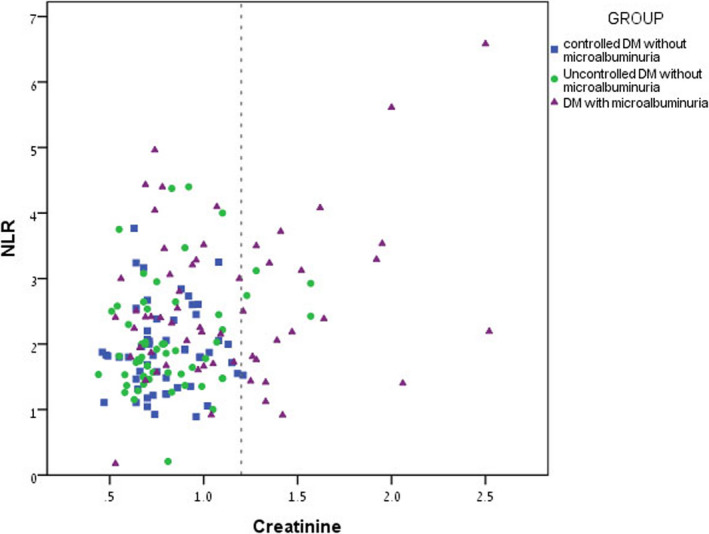
Scatter plot graphically presenting creatinine levels in the study groups: Group A presented in square shape, Group B presented in circle shape, and Group C presented in triangle shape. Note: creatinine units mg/dl
Official websites use .gov
A
.gov website belongs to an official
government organization in the United States.
Secure .gov websites use HTTPS
A lock (
) or https:// means you've safely
connected to the .gov website. Share sensitive
information only on official, secure websites.
Scatter plot graphically presenting creatinine levels in the study groups: Group A presented in square shape, Group B presented in circle shape, and Group C presented in triangle shape. Note: creatinine units mg/dl