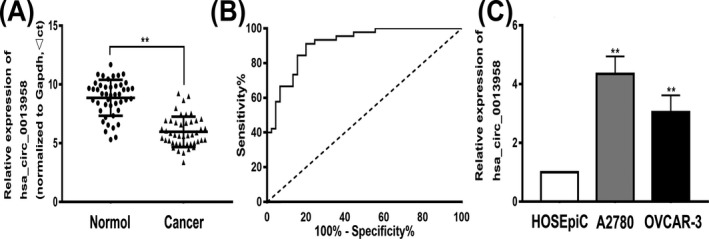
Figure 1.

Hsa_circ_0013958 endogenous expression and ROC curve in ovarian cancer. A, Hsa_circ_0013958 was highly expressed in ovarian cancer tissues compared with normal tissues. B, The ROC curves of hsa_circ_0013958. C, The hsa_circ_0013958 expression level was significantly higher in ovarian cancer cell lines (A2780 and OVCAR‐3) than in the normal ovarian cell line HOSEpiC. The data are presented as the mean ± SD. *P < .05, **P < .01
