
Figure EV3. Simulations of different bifurcation dynamics for the supercritical Hopf and SNIC bifurcations, respectively.
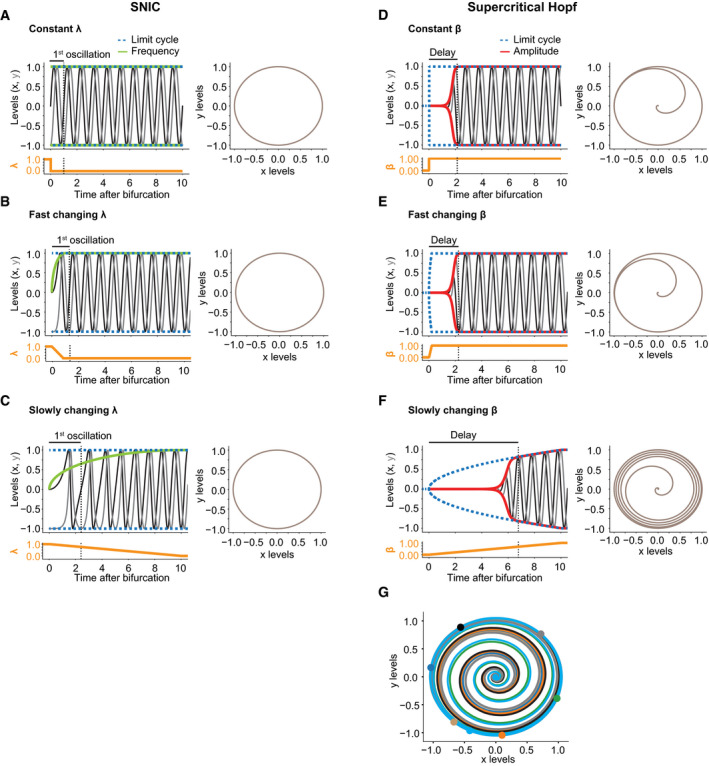
Simulations were performed for different dynamics of the parameter value using the model described in Materials and Methods. The resulting limit cycle is indicated in blue, the frequency for the SNIC bifurcations in green and the amplitude for the supercritical Hopf bifurcation in red. The change in the respective bifurcation parameter is indicated in the separate plot below in orange.
-
A–CSNIC bifurcations with their oscillatory behaviors upon instantaneous change to a constant value of λ (A), fast dynamic increase of λ (B), or slowly changing λ (C). The time to complete one oscillation is indicated on the top and in the dotted line, and the oscillatory behavior in the phase space is represented on the right.
-
D–FSupercritical Hopf bifurcations and resulting oscillatory behaviors upon instantaneous change to a constant value of β (D), fast dynamic increase of β (E), or slowly changing β (F). The delay indicates the time until the amplitude approaches the limit cycle, and the resulting oscillatory behavior is represented in the phase space on the right.
-
GStochastic simulations of a supercritical Hopf bifurcation after an instantaneous change to a constant value of β displayed in the phase space. Each iteration had the same initial conditions (x0 = 0, y0 = 0, constant β = 1) and additive white noise. The colored dots represent phase at which the individual oscillations reached the limit cycle.