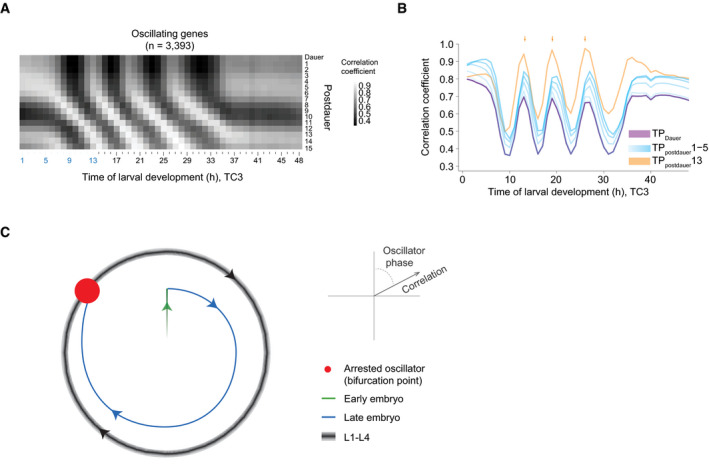
Figure 7. Re‐initiation of oscillations after dauer from an arrested oscillator phase.

- Pairwise‐correlation map of log2‐transformed oscillatory gene expression of dauer exit samples (“postdauer”) and fused larval time course (TC3) samples.
- Correlation of the indicated time points after plating dauer‐arrested animals on food (TPpostdauer) to the fused larval time course, TC3. ‘Dauer' indicates animals harvested before placing on food. Arrows indicate peaks of correlation to TP13/19/26 (300°) of TC3.
- Schematic depiction of behavior of the Caenorhabditis elegans oscillator from embryo to adult. A phase‐specific arrest (red dot) is observed at hatch, in early L1, young adults, and dauer‐arrested animals. See Appendix Fig S7 for additional data supporting four similar oscillation cycles during L1 through L4.
