
Figure 2. Organoid Histological and ECM analysis.
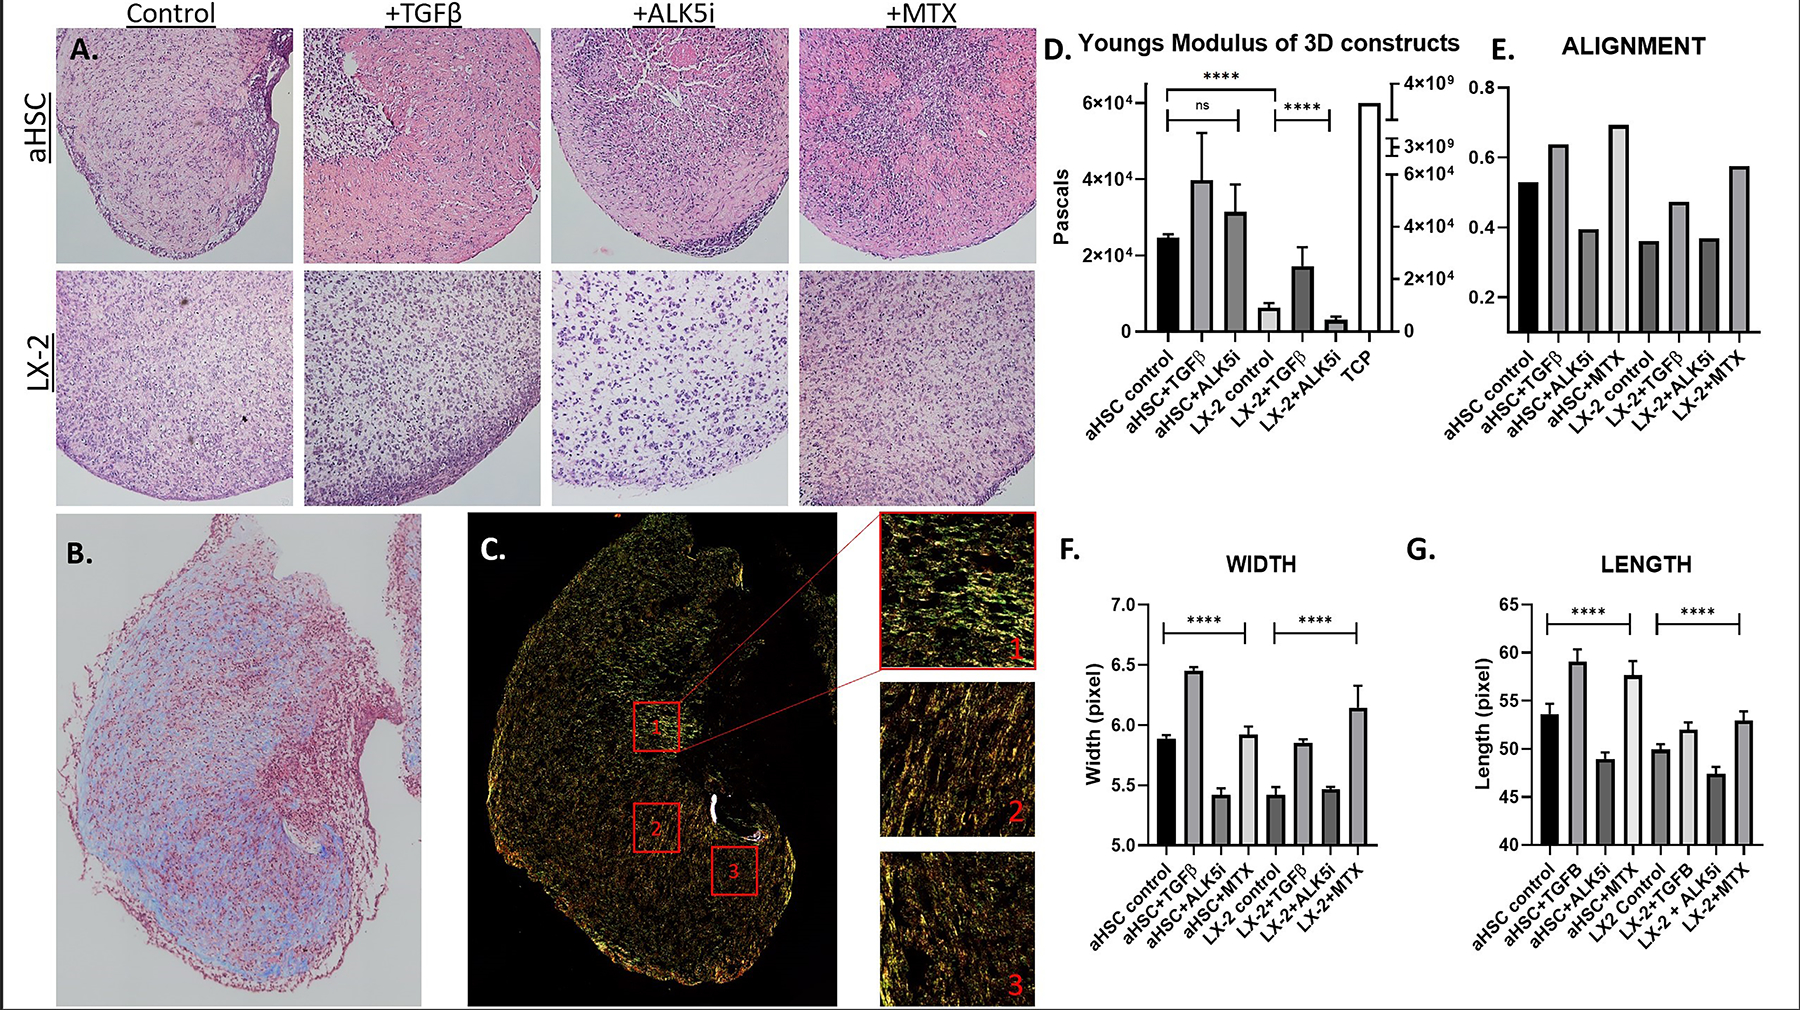
A) H&E staining of aHSC and LX-2 organoids cultured under control and experimental conditions, as described in the Methods. B) Masson’s Trichrome staining of aHSC organoids cultured under control conditions, denoting collagen in blue and cells in red. C) aHSC organoids cultured under control conditions were stained with Picrosirius red and imaged in polarized light. Left panels show 3 representative ROIs that were selected and analyzed using CT-FIRE and Curvealign. D) Stiffness of organoids cultured under control and experimental conditions, as indicated. E) Overall alignment of collagen fibers within organoid, cultured under control and experimental conditions, as indicated. Values closer to 1 represent complete alignment. F, G) Calculated width and length of collagen fibers within organoid, cultured under control and experimental conditions, as indicated. Statistical analysis using ANOVA shows significant impact of the different experimental conditions.