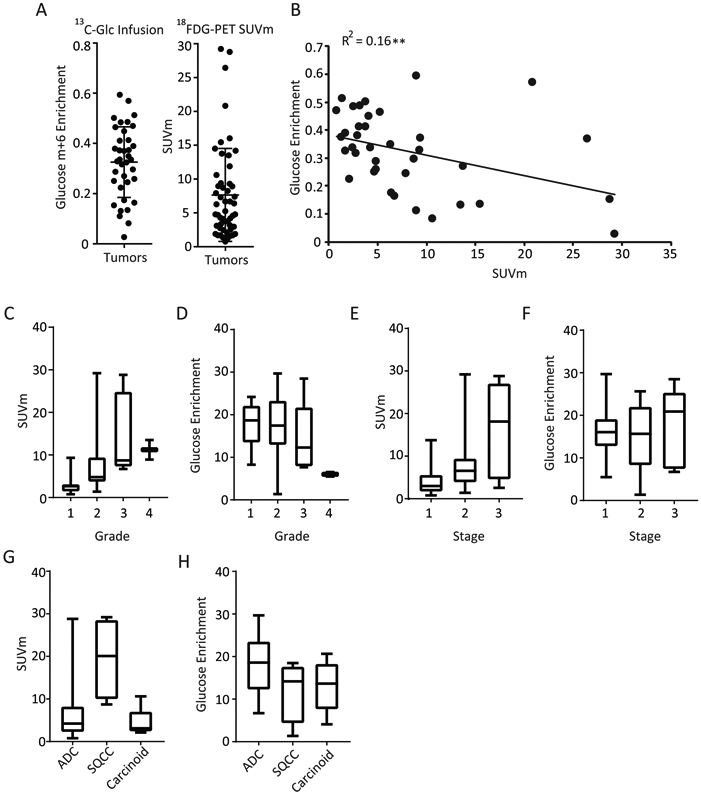
Figure 3:

A) 13C Glucose Enrichment(Glucose m+6) and Standard Uptake Value Maximum (SUVm) in 52 Study Patients [U-13C]glucose values of all tumor fragments is expressed as percent enrichment of the glucose pool (left). SUVm values of patients as determined by PET-CT (right). Data are expressed as average ± SD. B) Tumor Standard Uptake Value Maximum (SUVm) compared with Tumor 13C Glucose Enrichment Correlation of [U-13C]glucose enrichment vs. SUVm. Statistics are calculated by Spearman correlation co-efficient. ** p<0.01. C-D) SUVm values (C) and glucose enrichment (D) of the tumor as shown by grade. E-F) SUVm values (E) and glucose enrichment (F) of the tumor as shown by stage. G) SUVm and glucose compared by histology. C-H) Data are expressed as median with first and third quartiles. Error bars represent min and max values.
