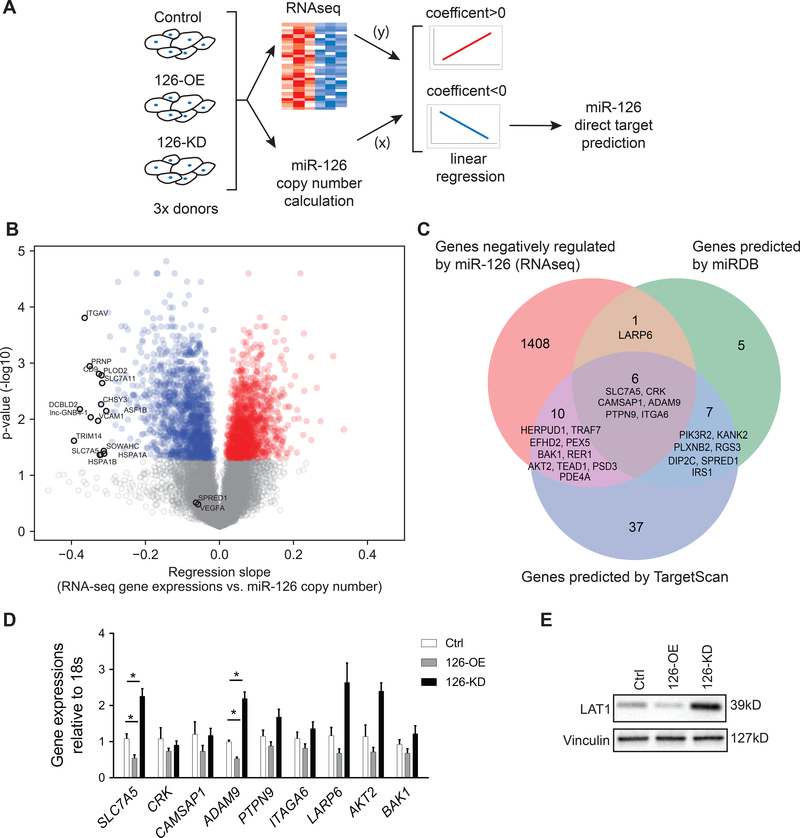
Figure 2. Global profiling of genes regulated by miR-126 followed by bioinformatics prediction of miR-126 direct targets.
A, Schematic overview of the study; HLMVEC from three individual donors were used as biological replicates. B, Volcano plot of genes positively (red) or negatively (blue) associated with miR-126 in HLMVEC with adjusted p< 0.05. Genes with adjusted p value > 0.05 are labelled in grey. The top 15 genes with the highest regression coefficient are annotated, as well as SPRED1 and VEGFA, known direct targets of miR-126 in HUVEC and cancer cells, respectively. C, Venn diagram of genes negatively associated with miR-126 identified in our RNA-seq analysis (left, orange), genes predicted as direct targets of miR-126 by miRDB (right, green) and by TargetScan (middle, blue). The overlapped genes are annotated and listed based on Aggregate PCT (highest to lowest) calculated by the computational algorithms of the two databases. D, RT-qPCR quantification of the six genes identified by all three approaches (center of the Venn graph in C) as well as additional three candidate genes (LARP6, AKT2 and BAK1) with angiogenic functions (n=5). E, Western blot quantification of SLC7A5 (LAT1) protein abundance. Results presented as mean ± SEM; *p<0.05; Statistical significance was determined by Friedman non-parametric test followed by Dunn’s multiple comparisons test in D.

