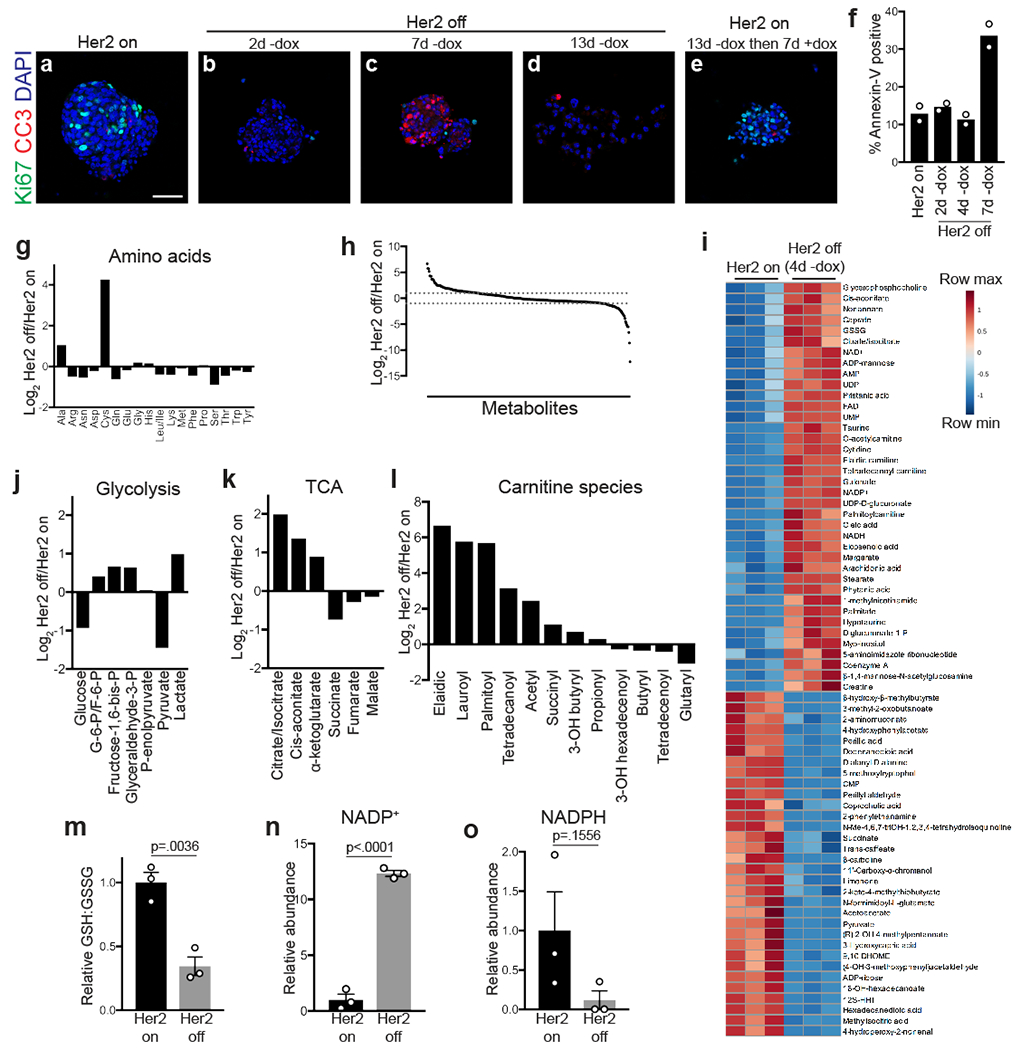
Fig. 1 |. Her2 downregulation induces metabolic changes.

a-e, Immunofluorescence staining for Ki67 (green) and cleaved caspase-3 (red) in mammospheres cultured in the presence of dox (A; Her2 on), without dox (Her2 off) for 2 days (B), 7 days (C), and 13 days (D), and without dox for 13 days before re-addition of dox for 7 days (E). Scale bar, 50 μm. Data represent 3 independent experiments. f, Percentage of Annexin V-positive cells in mammospheres cultured in the presence of dox (Her2 on), or without dox (Her2 off) for 2, 4, and 7 days. Data are shown as the mean of n=2 biologically independent replicates and are representative of 3 independent experiments. g, Changes in amino acid levels between Her2 off and Her2 on conditions. h, Ratio of metabolite levels between Her2 off and Her2 on conditions. Dashed lines represent 2-fold changes. i, Heatmap showing top 70 altered metabolites following Her2 downregulation in mammospheres. j-l, Changes in glycolytic intermediates (j), citric acid cycle (TCA) intermediates (k), and carnitine species (l) between Her2 off and Her2 on conditions. G6P, glucose-6-phosphate; F6P, fructose-6-phosphate. m, Relative ratio of reduced (GSH) to oxidized (GSSG) glutathione in cells with Her2 on or Her2 off. Data are shown as mean ± SEM for n=3 biologically independent replicates. Significance was determined by two-sided Student’s t test. n, Relative levels of oxidized NADP (NADP+) in cells with Her2 on or Her2 off. Data are shown as mean ± SEM for n=3 biologically independent replicates. Significance was determined by two-sided Student’s t test. o, Relative levels of reduced NADP (NADPH) in cells with Her2 on or Her2 off. Data are shown as mean ± SEM for n=3 biologically independent replicates. Significance was determined by two-sided Student’s t test.
