Figure 2.

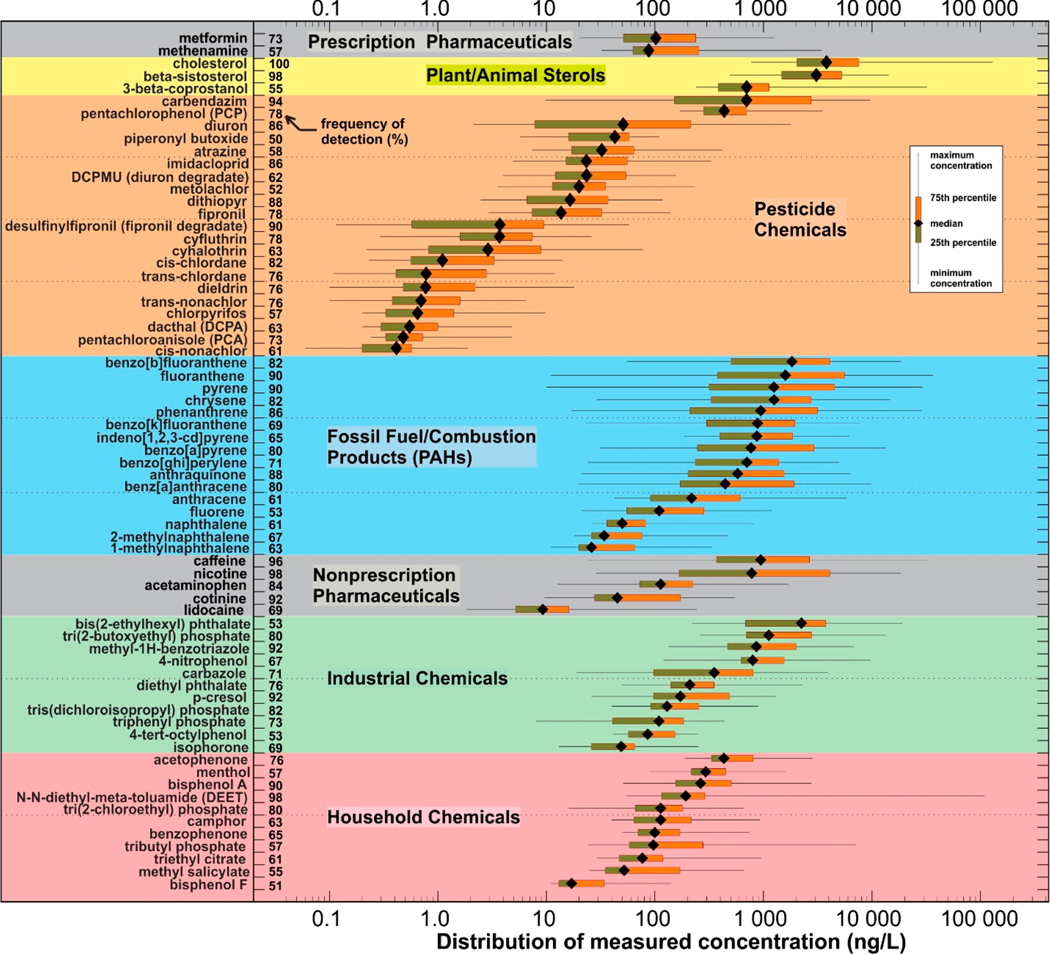
Box-plot distributions of measured concentrations for the 69 organic chemicals detected in 50% or more of 49 urban stormwater samples. Sorted alphabetically from top to bottom by chemical class and decreasing median concentrations.

Box-plot distributions of measured concentrations for the 69 organic chemicals detected in 50% or more of 49 urban stormwater samples. Sorted alphabetically from top to bottom by chemical class and decreasing median concentrations.