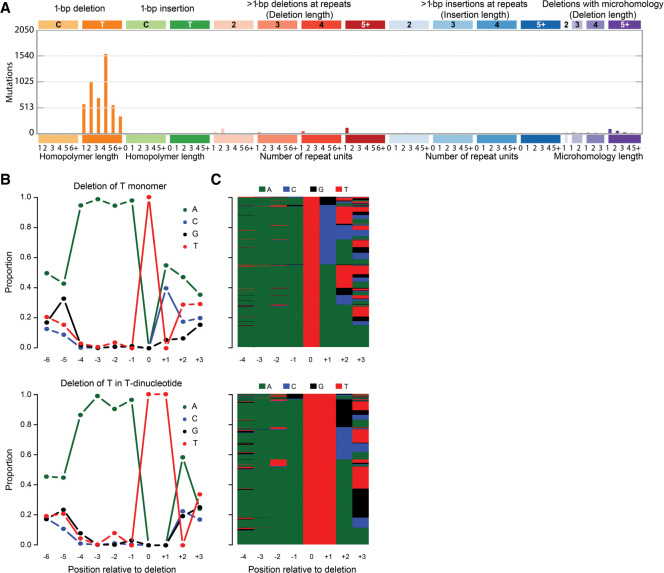
Figure 3.
In-depth characterization of the ID_AnT indel signature in the whole-genome data from tumor 62074759. (A) Spectrum of indels in the classification proposed by the PCAWG Consortium (Alexandrov et al. 2020). The indel spectrum is dominated by deletions of single thymines (orange). The numbers at the bottom indicate the lengths of the repeats in which the deletions occurred; “1” denotes deletions of thymines flanked by nonthymines, “2” denotes deletions of thymines in dinucleotides (TT > T), and so on. (B) Sequence contexts of deletions of single thymines not in a T-repeat (top) and in thymine dinucleotides (bottom). Supplemental Figure S6 provides analogous plots for thymine deletions in longer homopolymers. (C) Per-mutation view of sequence contexts of thymine deletions not in a T-repeat (top) and in a thymine dinucleotide (bottom); bases are indicated by colors as in panel B.

