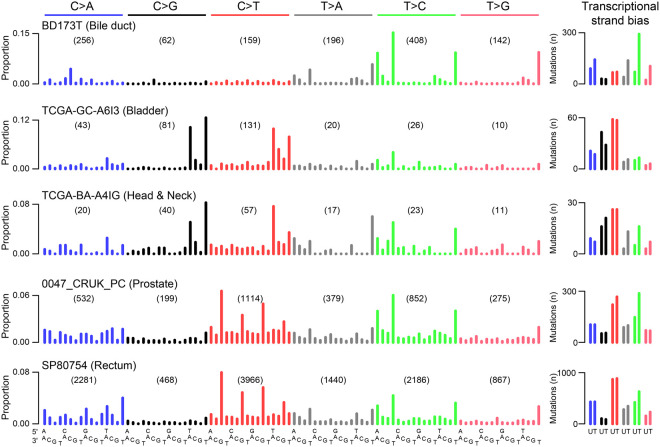
Figure 4.
Discovery of SBS_AnT in publicly available mutation data. Example spectra of tumors positive for SBS_AnT. The right panel shows the transcriptional strand bias; for the whole-genome samples, only SBSs in transcribed regions were included. The bile duct, bladder, and HNSCC tumors are whole-exome data; the prostate and rectal tumors are whole-genome data. (U) Untranscribed strand; (T) transcribed strand.

