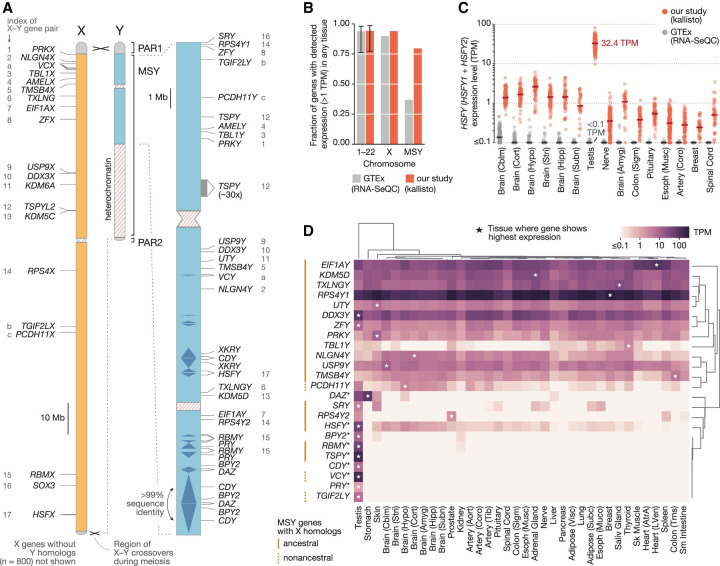
Figure 1.
Estimates of MSY gene expression across 36 human tissues. (A) Outside of the two pseudoautosomal regions (PAR1, PAR2), the X and Y Chromosomes have diverged in sequence. The locations of protein-coding genes and multicopy gene families in the male-specific region of the human Y Chromosome (MSY; blue) are shown at right. The X-linked homologs of MSY genes are annotated in the nonpseudoautosomal region of the X (orange); numbers (ancestral X–Y pairs) and letters (acquired X–Y pairs) match MSY genes to their X-linked homologs. (B) Fraction genes on autosomal chromosomes (1–22), the X Chromosome, or the MSY expressed above 1 TPM in at least one tissue when multimapping RNA-seq reads are discarded (gray) or included (red). Error bars, minimum and maximum values among individual autosomes. (C) Each point shows estimated expression level of the HSFY gene family in a single sample when multimapping reads are included (red) and discarded (gray). Lines show median expression levels. The 15 tissues shown are those with the highest median expression level after discarding multimapping reads, in descending order. (D) Median expression levels of MSY genes and gene families (*) in each tissue, with row and column order determined by hierarchical clustering. Asterisks denote the tissue with the highest expression for a given gene.

