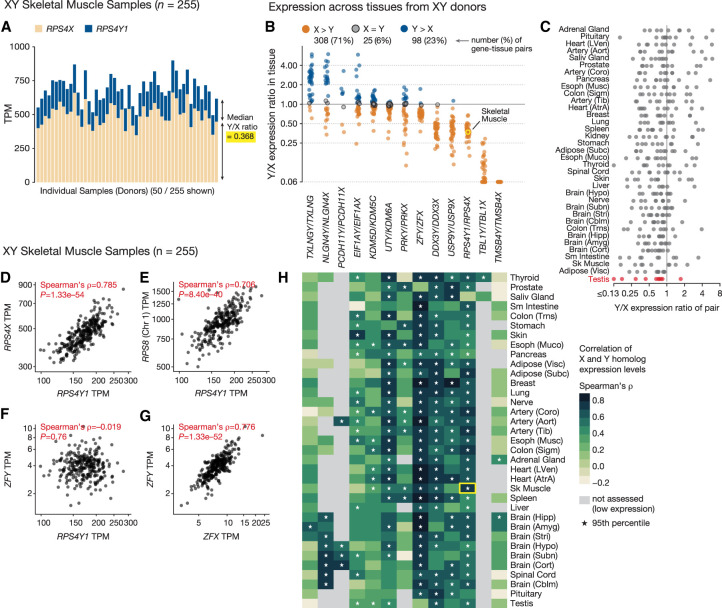
Figure 2.
Quantitative comparison of X- and Y-homolog expression in XY individuals. (A) Expression of RPS4Y1 (blue) and its X-linked homolog RPS4X (tan) in individual skeletal muscle samples (50 of 255 total samples are shown). (B,C) Each point shows Y/X expression ratio for one widely expressed X–Y gene pair in one tissue; points are grouped by gene pair (B) or tissue (C). In B, colors denote higher Y-homolog expression (blue), higher X-homolog expression (tan), or no significant difference (gray; Wilcoxon signed-rank test, FDR < 0.05). In C, Y/X expression ratios in testis are highlighted. Highlighted point (yellow) shows the summary of data in A. (D–G) Each point shows the coexpression of an MSY gene with another gene in a single skeletal muscle sample: RPS4Y1 versus RPS4X (D), RPS4Y1 versus RPS8 (E), RPS4Y1 versus ZFY (F), and ZFY versus ZFX (G). (H) Each cell shows the correlation coefficient (Spearman's ρ) of expression for X- and Y-linked members of an X–Y gene pair in one tissue. Asterisks indicate that a member of the X–Y pair shows more correlated expression with its homolog than with 95% of other genes in the genome. The highlighted cell (yellow) summarizes data in C and A.

