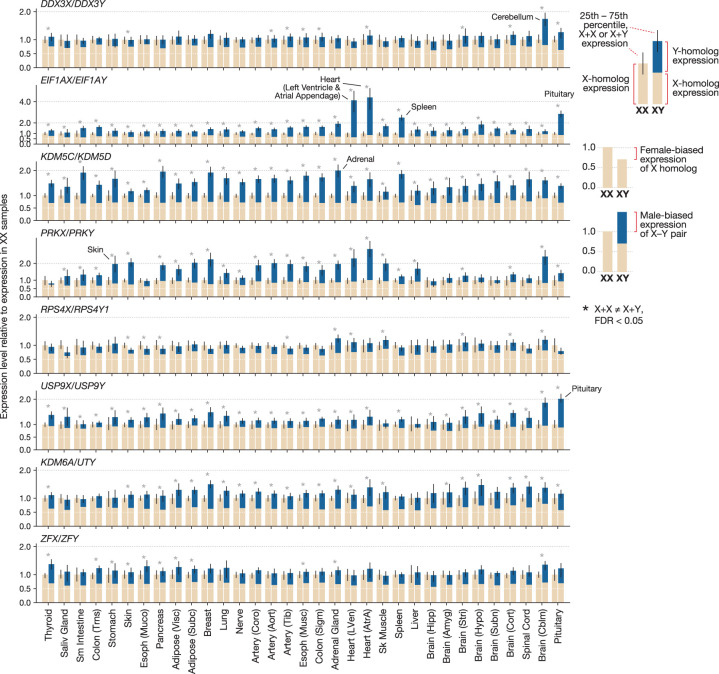
Figure 5.
Tissue-specific, male-biased expression of X–Y gene pairs at the transcriptional level. Each pair of bars shows the median expression level of an X–Y gene pair in XX (left) and XY (right) samples from one tissue. Expression is normalized to the level in XX samples. In XY samples, the sum of X-homolog (tan) and Y-homolog (blue) expression is shown. Error bars, 25th and 75th percentiles. An asterisk indicates X-homolog expression in XX samples is significantly different from the summed X- and Y-homolog expression in XY samples: FDR < 0.05.

