Figure 6.
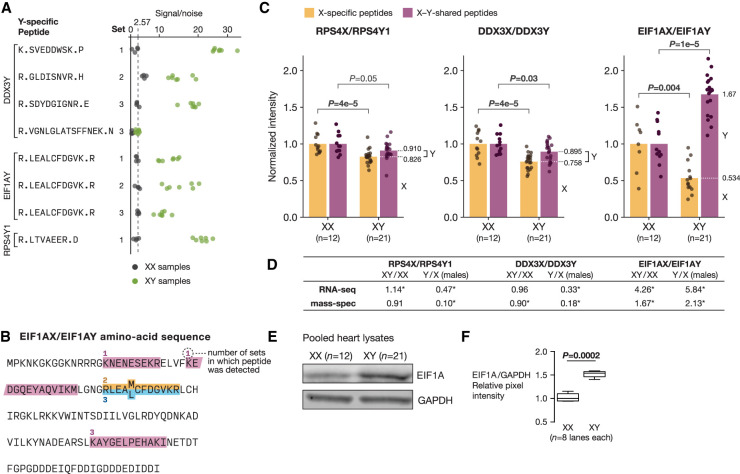
Male-biased expression of EIF1A protein in the heart. (A) Signal/noise values for Y-specific peptides in XX (gray) and XY (green) samples. Set refers to the 11-plex experiment (out of three total) in which the peptide was detected. The dotted line shows average signal/noise value in XX samples. (B) Amino-acid sequence of EIF1AX/Y: X- and Y-specific amino acids are superscripted and subscripted, respectively. X-specific (gold), Y-specific (blue), and X–Y shared (purple) peptides detected by mass spectrometry are shown, along with the number of 11-plex experiments in which each peptide was detected. (C) Relative abundance of X and Y protein isoforms in XX (n = 12) and XY (n = 21) heart tissue samples by mass spectrometry. For each X-Y pair, points show the levels of the X isoform (gold) or the total level of the X and Y isoform (purple) in XX samples compared with XY samples, from which the relative proportion of X and Y isoform expression in XY samples can be inferred (dotted white line). P-values by estimated by permutation. (D) Comparison of estimated Y/X expression ratios and sex-biased expression from RNA-seq and mass spectrometry. Asterisks indicate statistical significance in the corresponding analysis. (E) Abundance of EIF1A and GAPDH by western blot in pooled XX and XY protein lysates. (F) Quantification of EIF1A levels in pooled XX and XY samples by western blot; P-value by Welch's t-test.

