
Figure 2. Proteomic profiles of normal and cystic human cholangiocyte primary cultures.
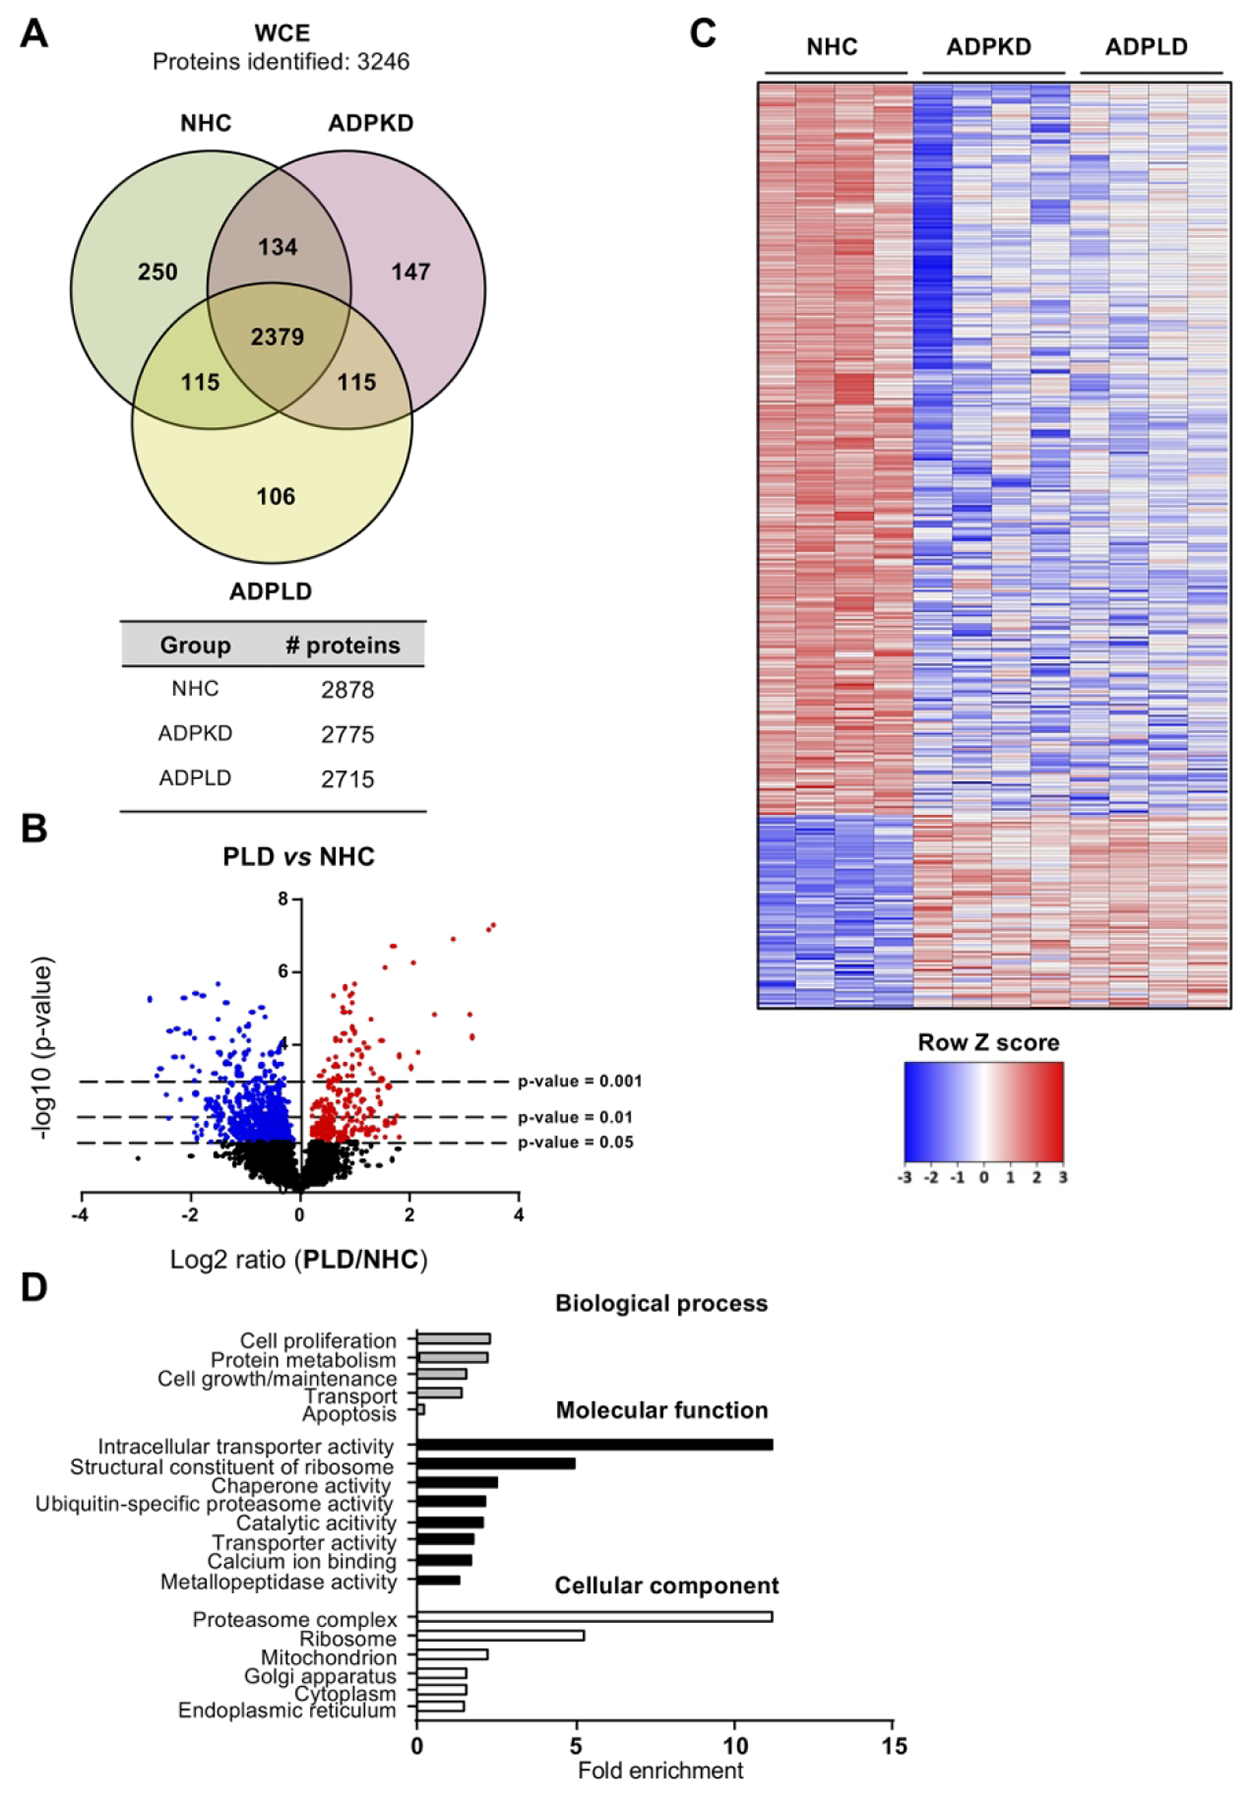
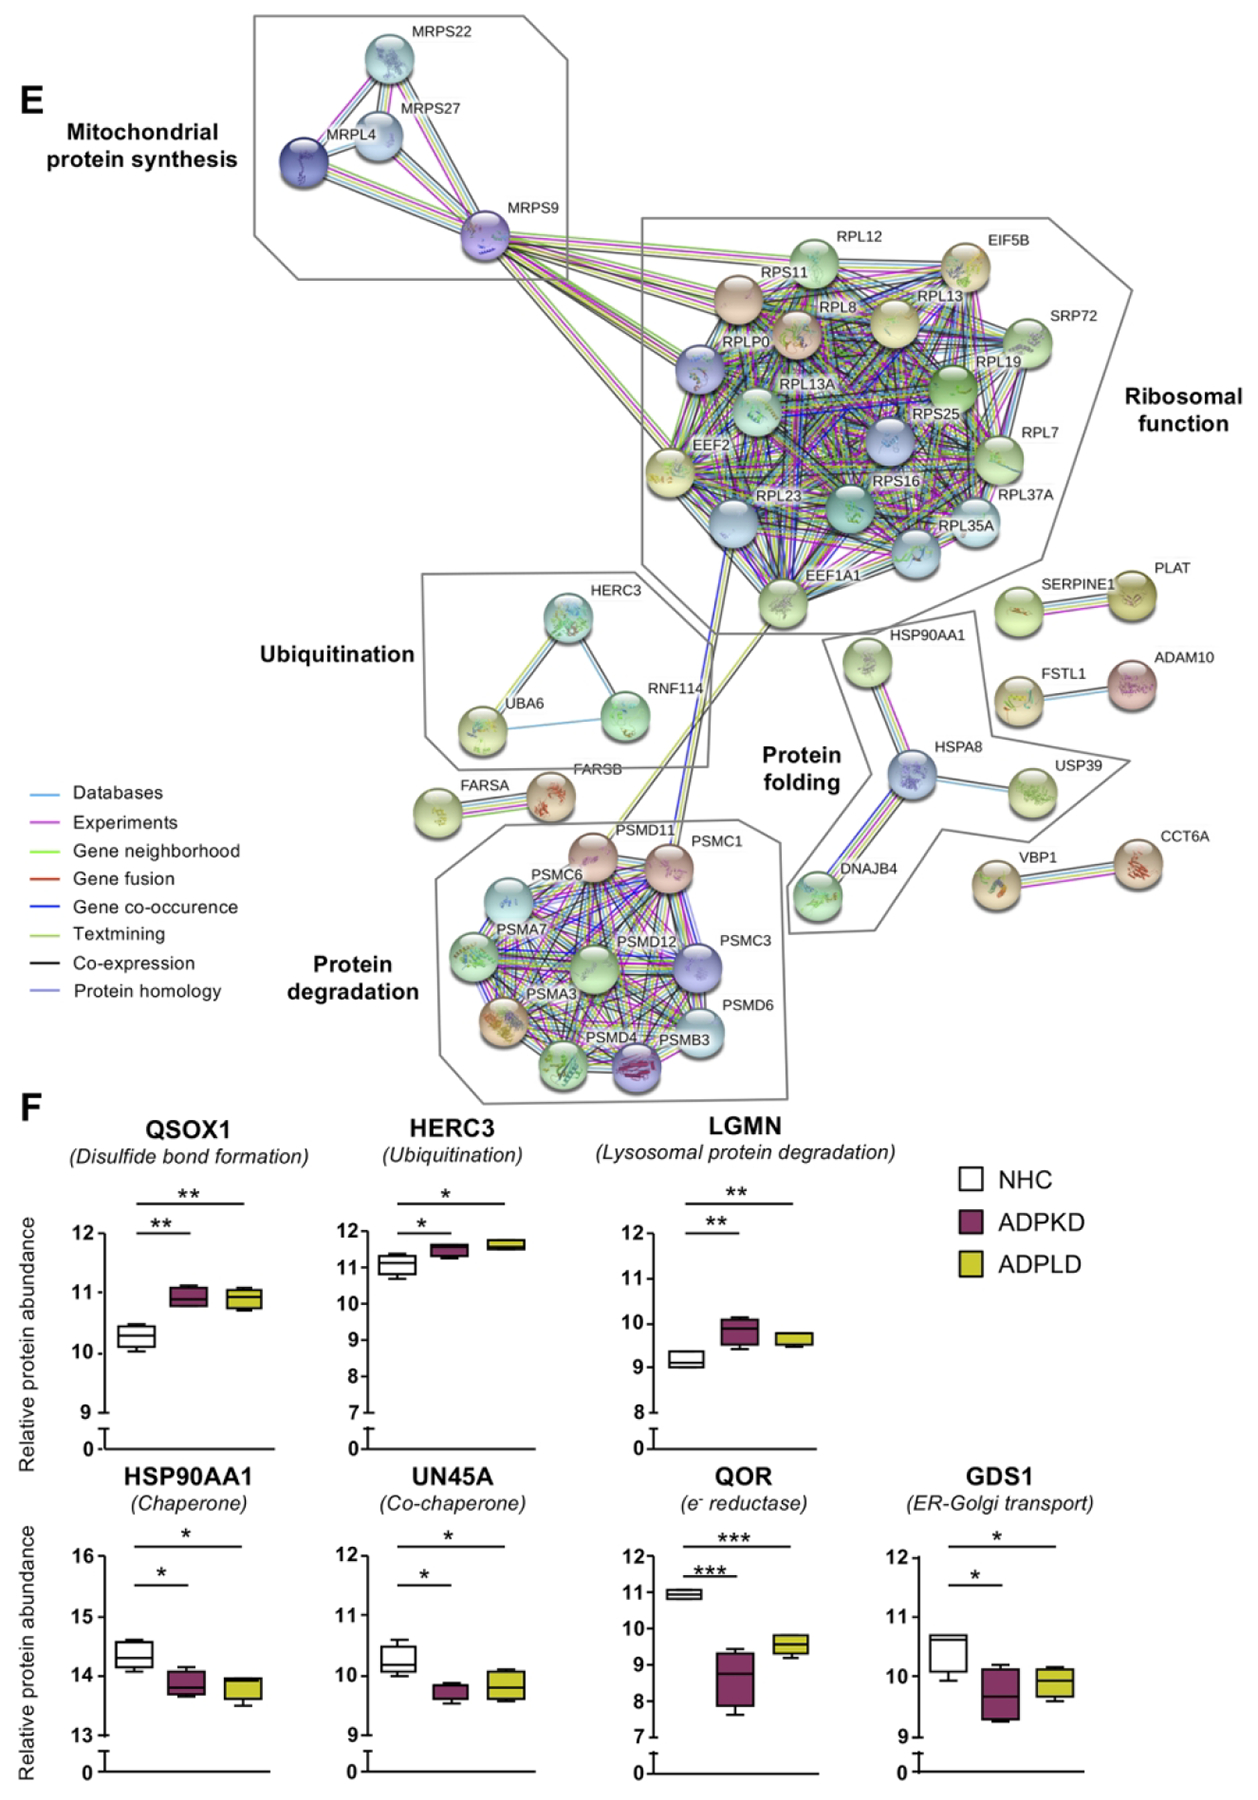
(A) Venn diagram with the proteins identified in each human cell type. (B) Volcano plot displaying the expression pattern and differences of all proteins identified in PLD vs NHC cholangiocytes. (C) Heatmap representing only the proteins differentially expressed in PLD (ADPKD and ADPLD) vs NHC. (D) GO classification of the proteins differentially expressed in PLD vs NHC. (E) STRING interaction analysis of the proteins differentially expressed in PLD vs NHC. (F) Box plot diagrams of the relative abundance of each selected protein in the three human cell types.