FIGURE 6.

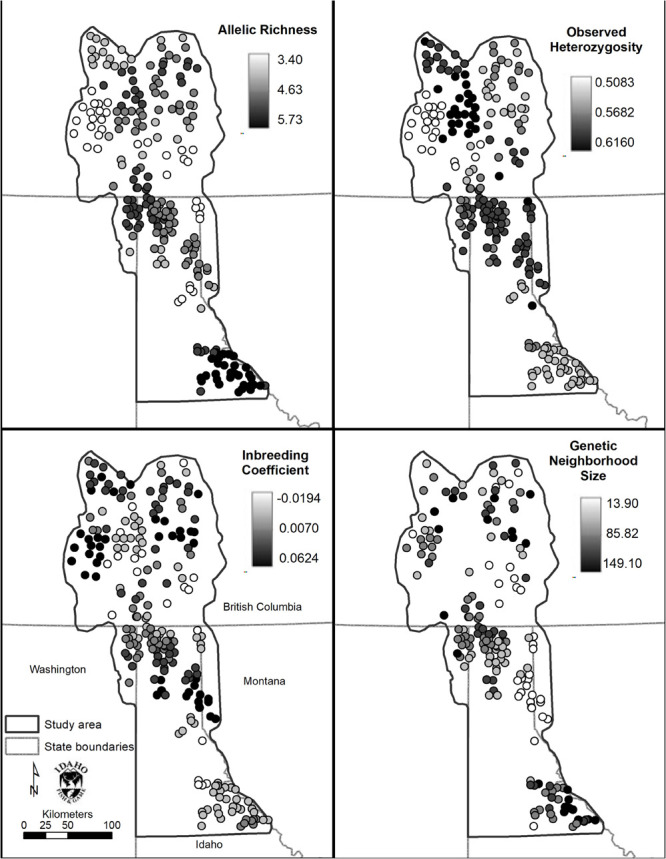
Spatial genetic distance (sGD) analysis results. Clockwise from top left: Allelic richness (Ar), observed heterozygosity (Ho), inbreeding coefficient (FIS), and genetic neighborhood size (NS).

Spatial genetic distance (sGD) analysis results. Clockwise from top left: Allelic richness (Ar), observed heterozygosity (Ho), inbreeding coefficient (FIS), and genetic neighborhood size (NS).