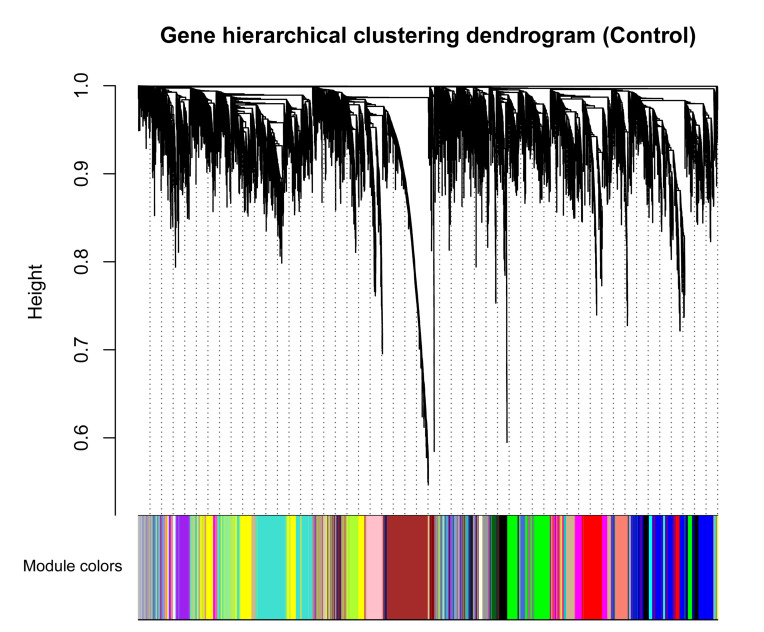
FIGURE 2.
Clustering dendrogram of genes based on a dissimilarity measure (1-TOM), which was then used to group genes into 25 modules in healthy samples. The branches correspond to modules of highly interconnected groups of genes. The height (y-axis) indicates the co-expression distance and the x-axis corresponds to genes. Colors represent the 25 different modules along with gray indicating genes that could not be assigned to any module.

