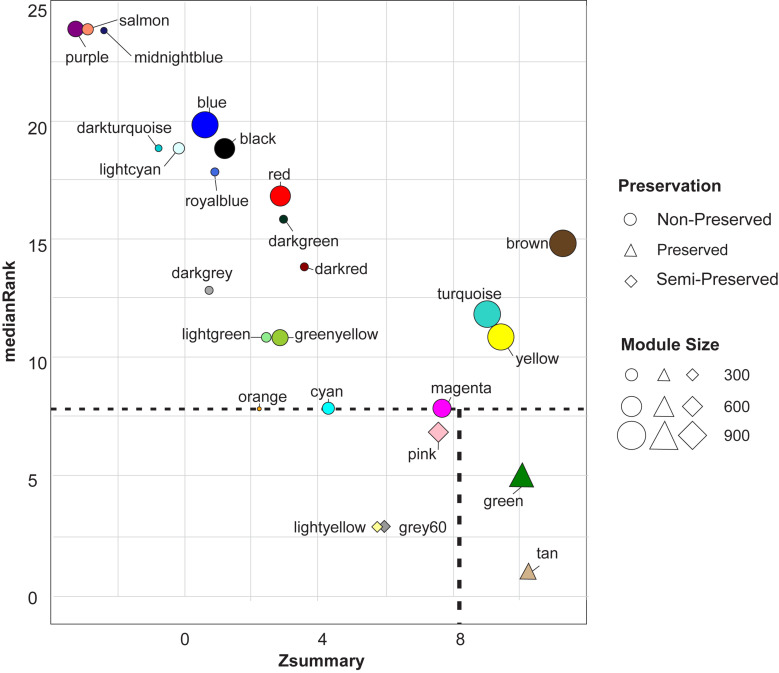
FIGURE 3.
The medianRank (left scatter plot) and Zsummary (right scatter plot) statistics of the module preservation. The medianRank and Zsummary of the modules close to zero indicate the high and low degree of module preservation, respectively. A negative Zsummary value indicates the modules’ disruption.

