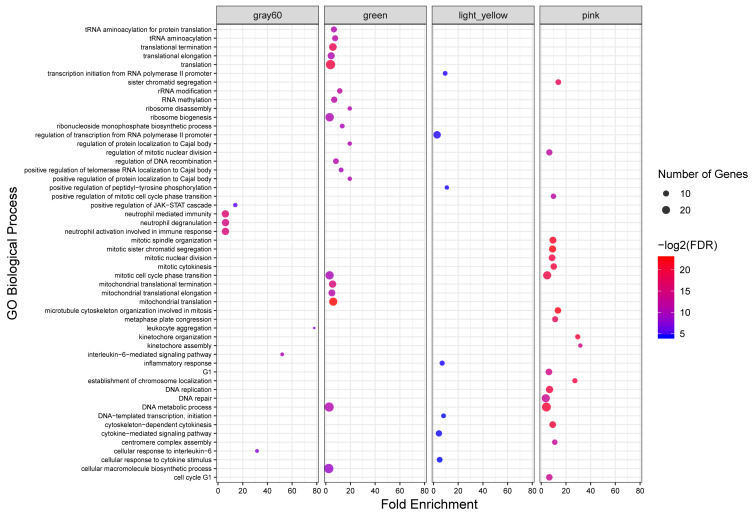
FIGURE 4.
GO analysis results of highly and semi-preserved modules. Owing to the large number of significant GO terms (biological process) in the green and pink modules, only the top 20 significant terms are displayed. Size and color of points represent -Log2 of FDR and number of genes associated with each term, respectively.

