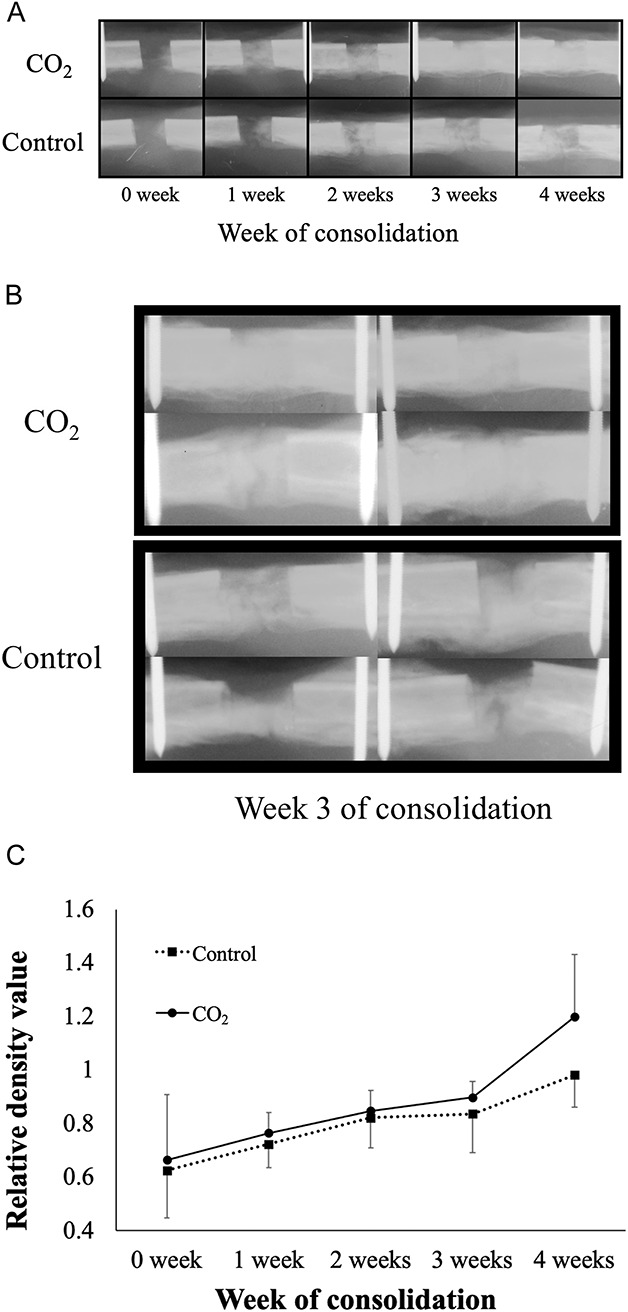
Fig. 2 A-C.

(A) Sequential plain radiographs of the distracted area. (B) Plain radiographs of the distracted area at Week 3. (C) Radiographs of the CO2 group showed higher pixel values (relative density) than did those in the control group at week 4 of the consolidation phase (data shown are mean and SD).
