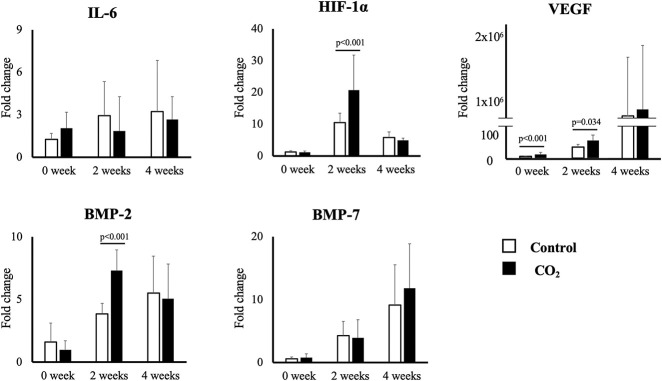
Fig. 5.
This figure shows the mean (and SD) for expression of the five genes of interest in each group at each time point as measured using quantitative real-time polymerase chain reaction. The expression of HIF-1α and BMP-2 at Week 2 and the expression of VEGF at Weeks 0 and 2 were higher in the CO2 group than in the control group.

