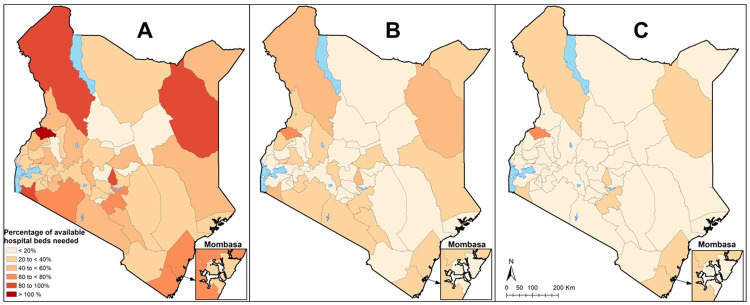
Fig 2. General hospital bed surge capacity for the 47 counties under the three different transmission scenarios.
The maps show % of available general hospital bed capacity that will be needed if 2% of the population are infected and develop symptoms over under A) the 6-month transmission scenario, B) the 12-month transmission scenario and C) the 18-month transmission scenario. Proportions are shown to increase from light red to dark red.

