
Figure 1.
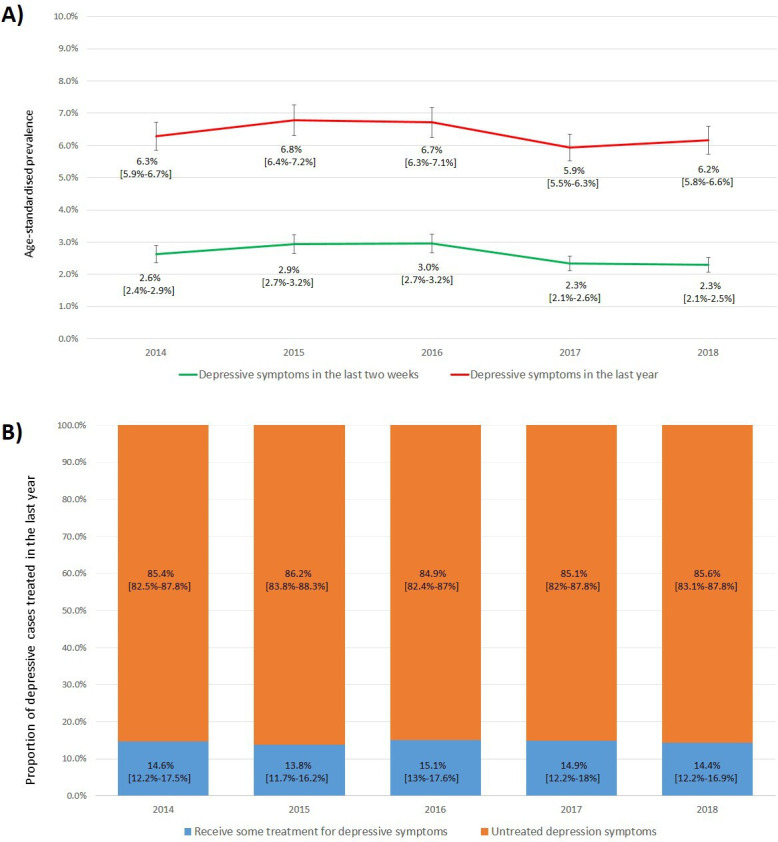
Age-standardised prevalence of depressive symptoms and proportion of depressive cases treated in Peru between 2014 and 2018. (A) Age-standardised prevalence of depressive symptoms in the last year and the last 2 weeks in Peru by year. (B) Proportion of depressive cases treated in the last year in Peru by year. In all the analyses, the weighted proportion by complex sampling was used.