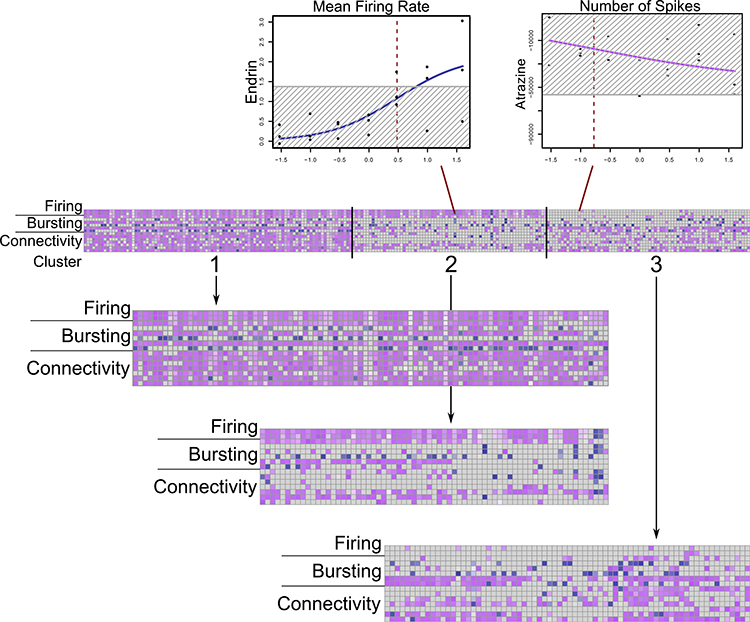
Fig. 2.
Heatmap of three potency-driven activity patterns in k-means clusters of chemical-parameter hits. Blue = increased activity, purple = decreased activity. Darker colors = lower chemical AC50s. Sample dose-response curves shown for an active and inactive chemical-parameter. Red lines = log10(AC50), grey box = 3*BMAD

