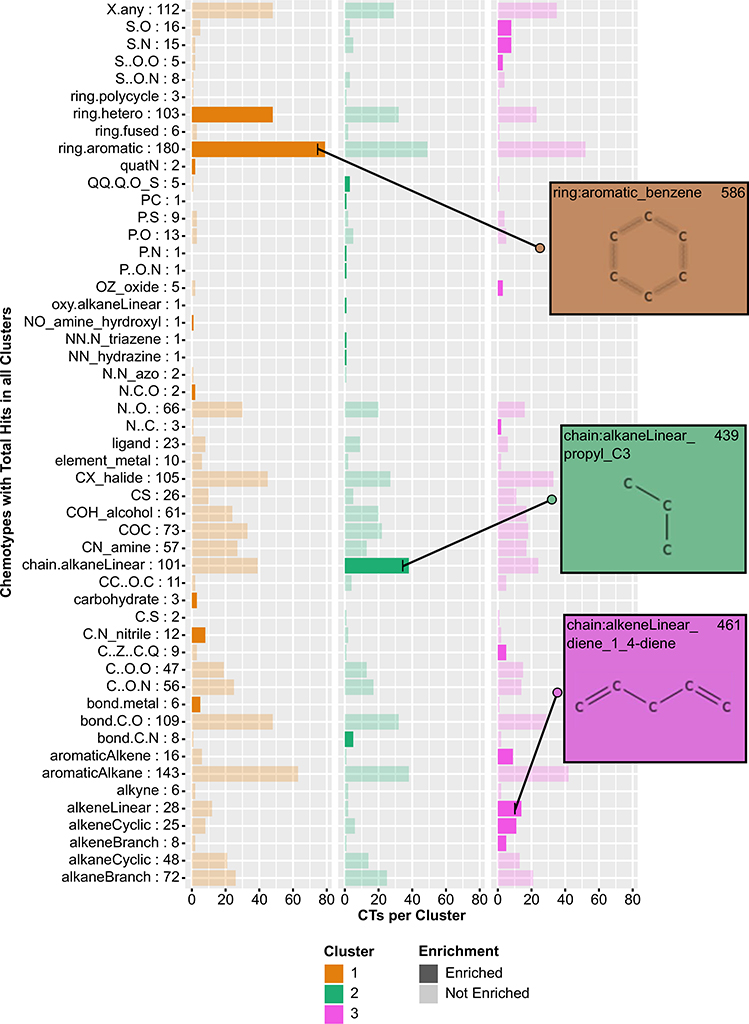
Fig. 4.
Barplot describing enriched chemotypes within three potency-driven k-means clusters. Number of CTs within all clusters in row label. Darker bars = enriched CTs within cluster. Inset images depict structures within respective CT. More complete CT descriptions can be found in the chemotyper application

