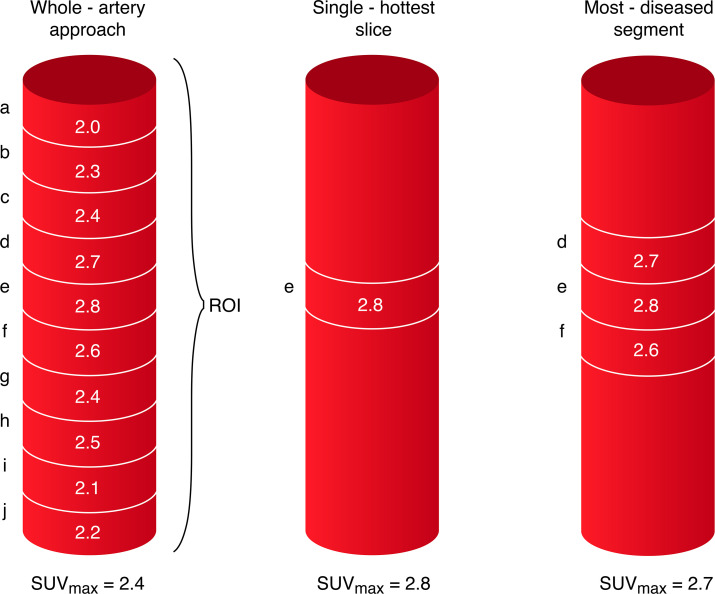
Figure 3.
Schematic representation of 18-F-FDG PET-CTA image acquisition. Ten regions of interest (ROI) are defined as 1 mm thick slices above and below the area of maximal luminal narrowing in the symptomatic carotid artery. Thirty ROI are defined superior to the carotid bifurcation in the contralateral asymptomatic carotid artery (not shown). 18-F-FDG uptake in the vessel wall is quantified using (SUV (g/mL)) with the highest uptake in each slice defined as the SUVmax. The whole-artery approach to measuring vessel inflammation calculates the average of the SUVmax across the ROI(a+b+c+d+e+f+g+h+i+j/10). The SHS is defined as the axial slice with highest SUVmax(slice ‘e’). 18F-FDG-uptake in the most-diseased-segment is taken as the average of the SUVmax across three slices defined relative to the SHS (d+e+ f/3). 18F-FDG PET, 18F-fluorodeoxyglucose positron emission tomography; CTA, CT angiography; SUVmax, maximum standardised uptake value.

