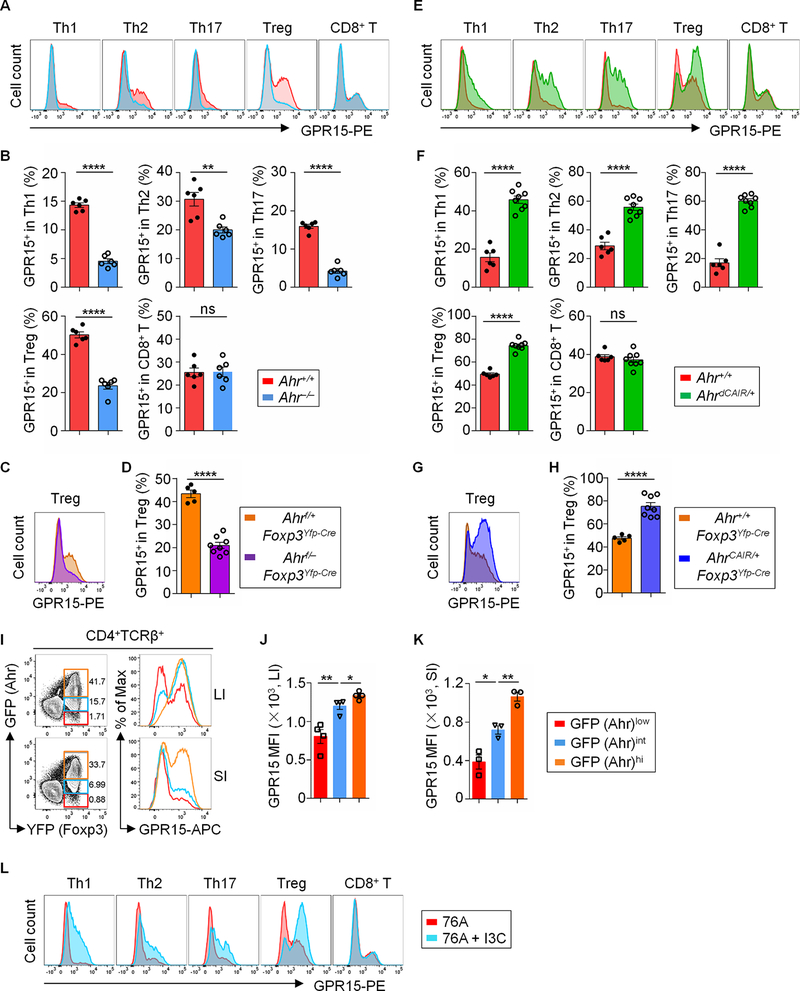
Fig. 1. GPR15 in CD4+ T cells is most prominently expressed by large intestinal Tregs and controlled by Ahr.
(A) Flow cytometry analysis of GPR15 expression in Th1 (CD4+TCRβ+Foxp3−GATA3−T-bet+), Th2 (CD4+TCRβ+Foxp3−GATA3+), Th17 (CD4+TCRβ+Foxp3−GATA3−RORγt+), Treg (CD4+TCRβ+Foxp3+) and CD8+ (CD8+TCRβ+) T cells isolated from lamina propria of the large intestine (LI) of Ahr+/+ and Ahr−/− littermate mice. Data are representative of four independent experiments. (B) Percentages of the GPR15+ proportion among Th1/Th2/Th17/Treg/CD8+ T cells from LI of Ahr+/+ and Ahr−/− littermate mice. Data are shown as mean ± SEM (n =6 mice per group). (C) Flow cytometry analysis of GPR15 expression in Tregs from LI of the indicated littermate mice. Data are representative of three independent experiments. (D) Percentages of GPR15+ proportion in Tregs from LI of the indicated littermate mice. Data are shown as mean ± SEM (n = 5–8 mice per group). (E) Flow cytometry analysis of GPR15 expression in Th1, Th2, Th17, Treg and CD8+ T cells from LI of Ahr+/+ and AhrdCAIR/+ littermate mice. Data are representative of three independent experiments. (F) Percentages of the GPR15+ proportion among Th1/Th2/Th17/Treg/CD8+ T cells from LI of the indicated littermate mice. Data are shown as mean ± SEM (n = 6–8 mice per group). (G) Flow cytometry analysis of GPR15 expression in Tregs from LI of the indicated littermate mice. Data are representative of three independent experiments. (H) Percentages of GPR15+ proportion in Tregs from LI of the indicated littermate mice. Data are shown as mean ± SEM (n = 5–8 mice per group). (I) The expression of GPR15 by each individual Treg population corresponding to different levels of Ahr expression (GFP), depicted in color (i.e., orange, blue and red; left column) was analyzed by flow cytometry (right column). Data are representative of two independent experiments. The compiled data for MFI (mean fluorescence intensity) of GPR15 expression in each individual Treg population corresponding to different levels of Ahr expression (GFP) from LI (J) and SI (K) was shown as mean ± SEM (n = 3–4 mice per group). (L) Flow cytometry analysis of GPR15 expression by Th1/Th2/Th17/Treg/CD8+ T cells in LI of littermate C57BL/6 wild-type mice fed with Ahr ligand-deficient diet (AIN-76A) or AIN–76A with addition of Ahr ligand I3C (76A+ I3C). Data are representative of two independent experiments. Also see fig. S1 and S2, and Table S2.

