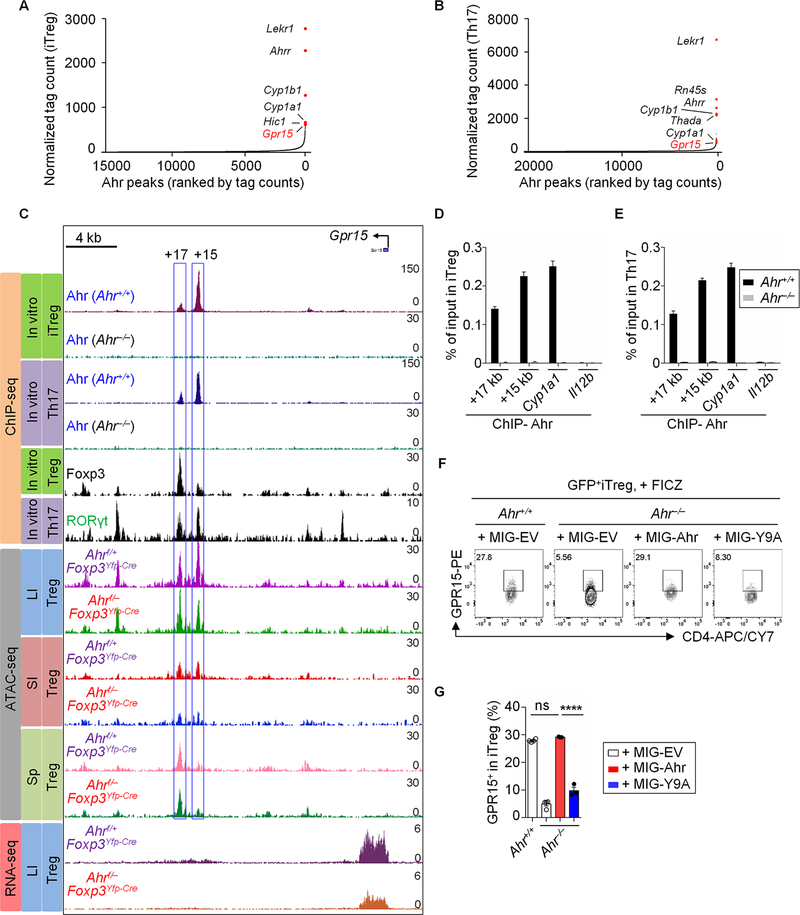
Fig. 2. Ahr regulates GPR15 expression by directly binding to the Gpr15 locus.
(A and B) Ranking of Ahr binding intensity at high-confidence regions from ChIP-seq in iTreg (A) or Th17 (B). (C) ChIP-seq: recruitment of Ahr, Foxp3 or RORγt to the Gpr15 locus in iTregs and/or Th17, as measured by ChIP-seq in this study (for Ahr) or published ChIP-seq data (for Foxp3 and RORγt). ATAC-seq: representative ATAC-seq tracks at the Gpr15 locus in Tregs sorted from the LI, SI or Sp of Ahrf/+ Foxp3Yfp-Cre or Ahrf/− Foxp3Yfp-Cre littermate mice. RNA-seq: representative RNA-seq tracks at the Gpr15 locus in Tregs sorted from the LI of Ahrf/+ Foxp3Yfp-Cre or Ahrf/−Foxp3Yfp-Cre littermate mice. (D and E) ChIP assay of iTreg (D) and Th17 (E) from Ahr+/+ or Ahr−/− littermate mice. Enrichment of Ahr at the site 17 kb (+17 kb) or 15 kb (+15 kb) downstream of the transcription start site of Gpr15 was determined by real-time PCR. Data are representative of three independent experiments and are shown as mean ± SEM (n = 4). Ahr enrichment at Cyp1a1 and Il12b locus were used as positive and negative controls respectively for Ahr ChIP assay. (F) Flow cytometry analysis of GPR15 expression in iTregs transduced with retroviral constructs encoding MIG-Ahr, MIG-Y9A or control (MIG-EV). The cells were treated with FICZ at day 2. Data are representative of two independent experiments. (G) Percentages of the GPR15+ proportion in iTregs from Ahr+/+ and Ahr−/− littermate mice transduced with retroviral constructs encoding MIG-Ahr, MIG-Y9A or control (MIG-EV). Data are shown as mean ± SEM (n = 3–4).

