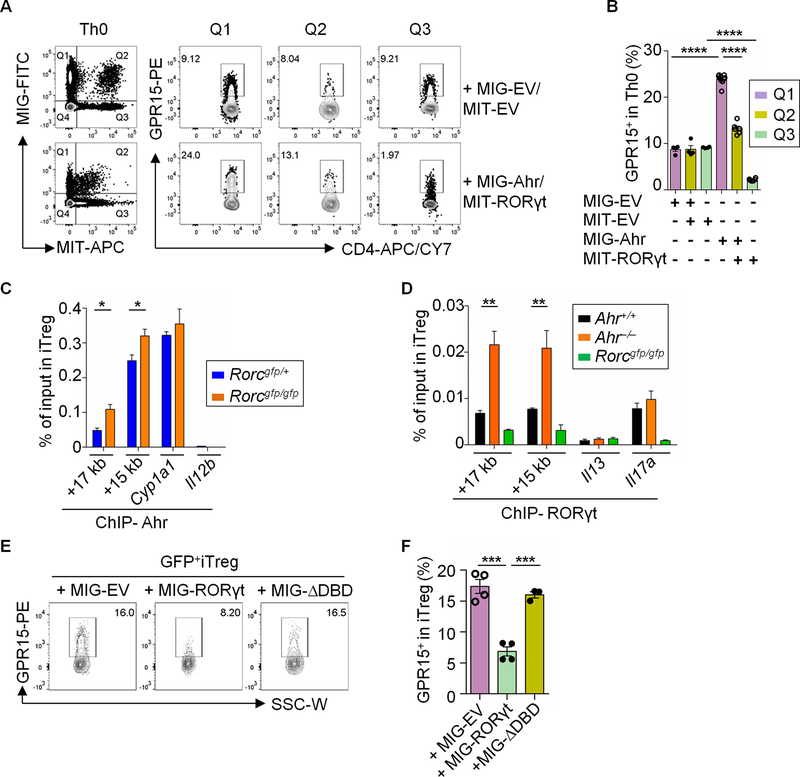
Fig. 5. RORγt antagonizes Ahr for DNA binding at the Gpr15 locus.
(A) Flow cytometry analysis of GPR15 expression by Th0 cells co-transduced with control retroviral constructs MIG-EV and MIT-EV or MIG-Ahr and MIT-RORγt. Data are representative of two independent experiments. (B) Percentages of the GPR15+ proportion by Th0 cells co-transduced with MIG-EV and MIT-EV or MIG-Ahr and MIT-RORγt. Data are shown as mean ± SEM (n = 4–6). (C) ChIP assay of iTregs from Rorcgfp/+ or Rorcgfp/gfp littermate mice. Enrichment of Ahr at the site 17 kb (+17 kb) or 15 kb (+15 kb) downstream of the transcription start site of Gpr15 was determined by real-time PCR. Data are representative of two independent experiments and are shown as mean ± SEM (n = 3). Ahr enrichment at Cyp1a1 and Il12b locus were used as positive and negative controls respectively. (D) ChIP assay of iTregs from Ahr+/+ or Ahr−/− littermate mice. Enrichment of RORγt at the site 17 kb (+17 kb) or 15 kb (+15 kb) downstream of the transcription start site of Gpr15 was determined by real-time PCR. Data are representative of two independent experiments and are shown as mean ± SEM (n = 4). RORγt enrichment at the Il13 or Il17a locus was used as negative or positive control, respectively. (E) Flow cytometry analysis of GPR15 expression in iTregs transduced with MIG-EV, MIG-RORγt or MIG-ΔDBD. Data are representative of three independent experiments. (F) Percentages of the GPR15+ proportion in iTregs from Rorcgfp/gfp mice transduced with MIG-EV, MIG-RORγt or MIG-ΔDBD. Data are shown as mean ± SEM (n = 3–4). Also see fig. S4.

