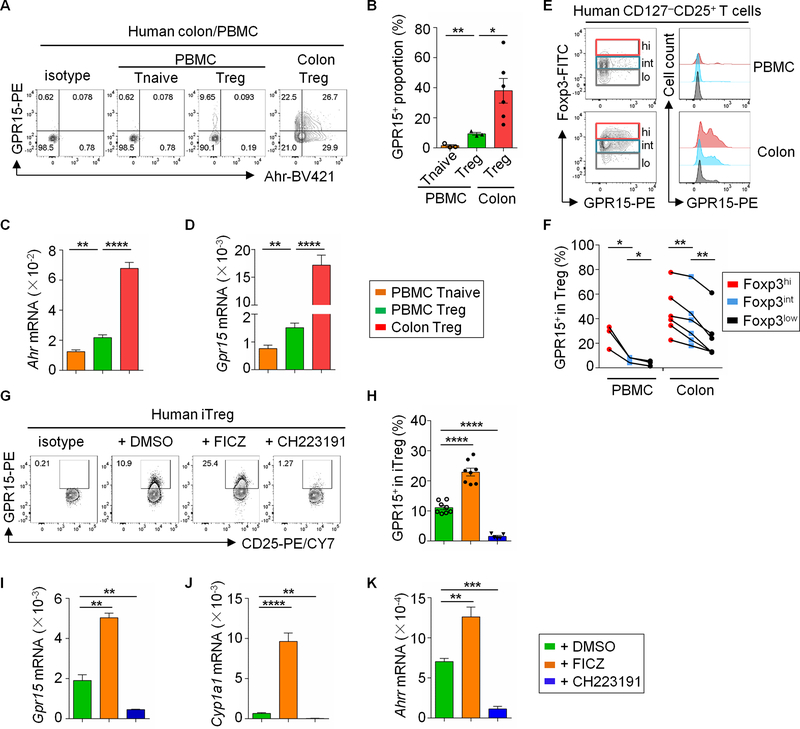
Fig. 7. Ahr signaling promotes GPR15 expression in human Tregs.
(A) Flow cytometry analysis of GPR15 and Ahr expression in human PBMC and colonic Tregs (CD3+CD4+CD45RA–CD45RO+CD127–CD25+Foxp3+). Data are representative of three independent experiments. (B) Percentages of GPR15+ proportion in Tregs from human PBMC and colonic LPLs. Data are shown as mean ± SEM (n = 3–6). (C and D) Ahr mRNA (C) had a positive correlation with that of Gpr15 (D) in human Tregs. Data are shown as mean ± SEM (n = 4–6). (E) The expression of GPR15 by each CD127–CD25+ T cell subset defined by different levels of Foxp3 expression, depicted in color (i.e., red, blue and grey; left column) was analyzed by flow cytometry (right column). Data are representative of three independent experiments. (F) Percentages of the GPR15+ proportion in each CD127–CD25+ T cell subset defined by different levels of Foxp3 expression from PBMC and human colon. The symbols connected with a line represent data from the same individual donors (n = 3–6). The statistical analysis was performed with paired Student’s t test. (G) Flow cytometry analysis of GPR15 and CD25 expression in iTregs (CD4+CD45RA–CD45RO+CD127–CD25+Foxp3+) from sorted naïve CD4+ T cells (CD3+CD4+CD45RA+CD25–) of PBMC, with the addition of DMSO, FICZ or CH223191. Data are representative of three independent experiments. (H) Percentages of GPR15+ proportion in sub-population of iTregs with indicated treatment. Data are shown as mean ± SEM (n = 5–8). (I–K) The mRNA level of Gpr15 and other Ahr target genes (Cyp1a1 and Ahrr) was enhanced by FICZ addition while abolished by CH223191 treatment. Data are representative of three independent experiments and shown as mean ± SEM (n = 5). See also fig. S6.

