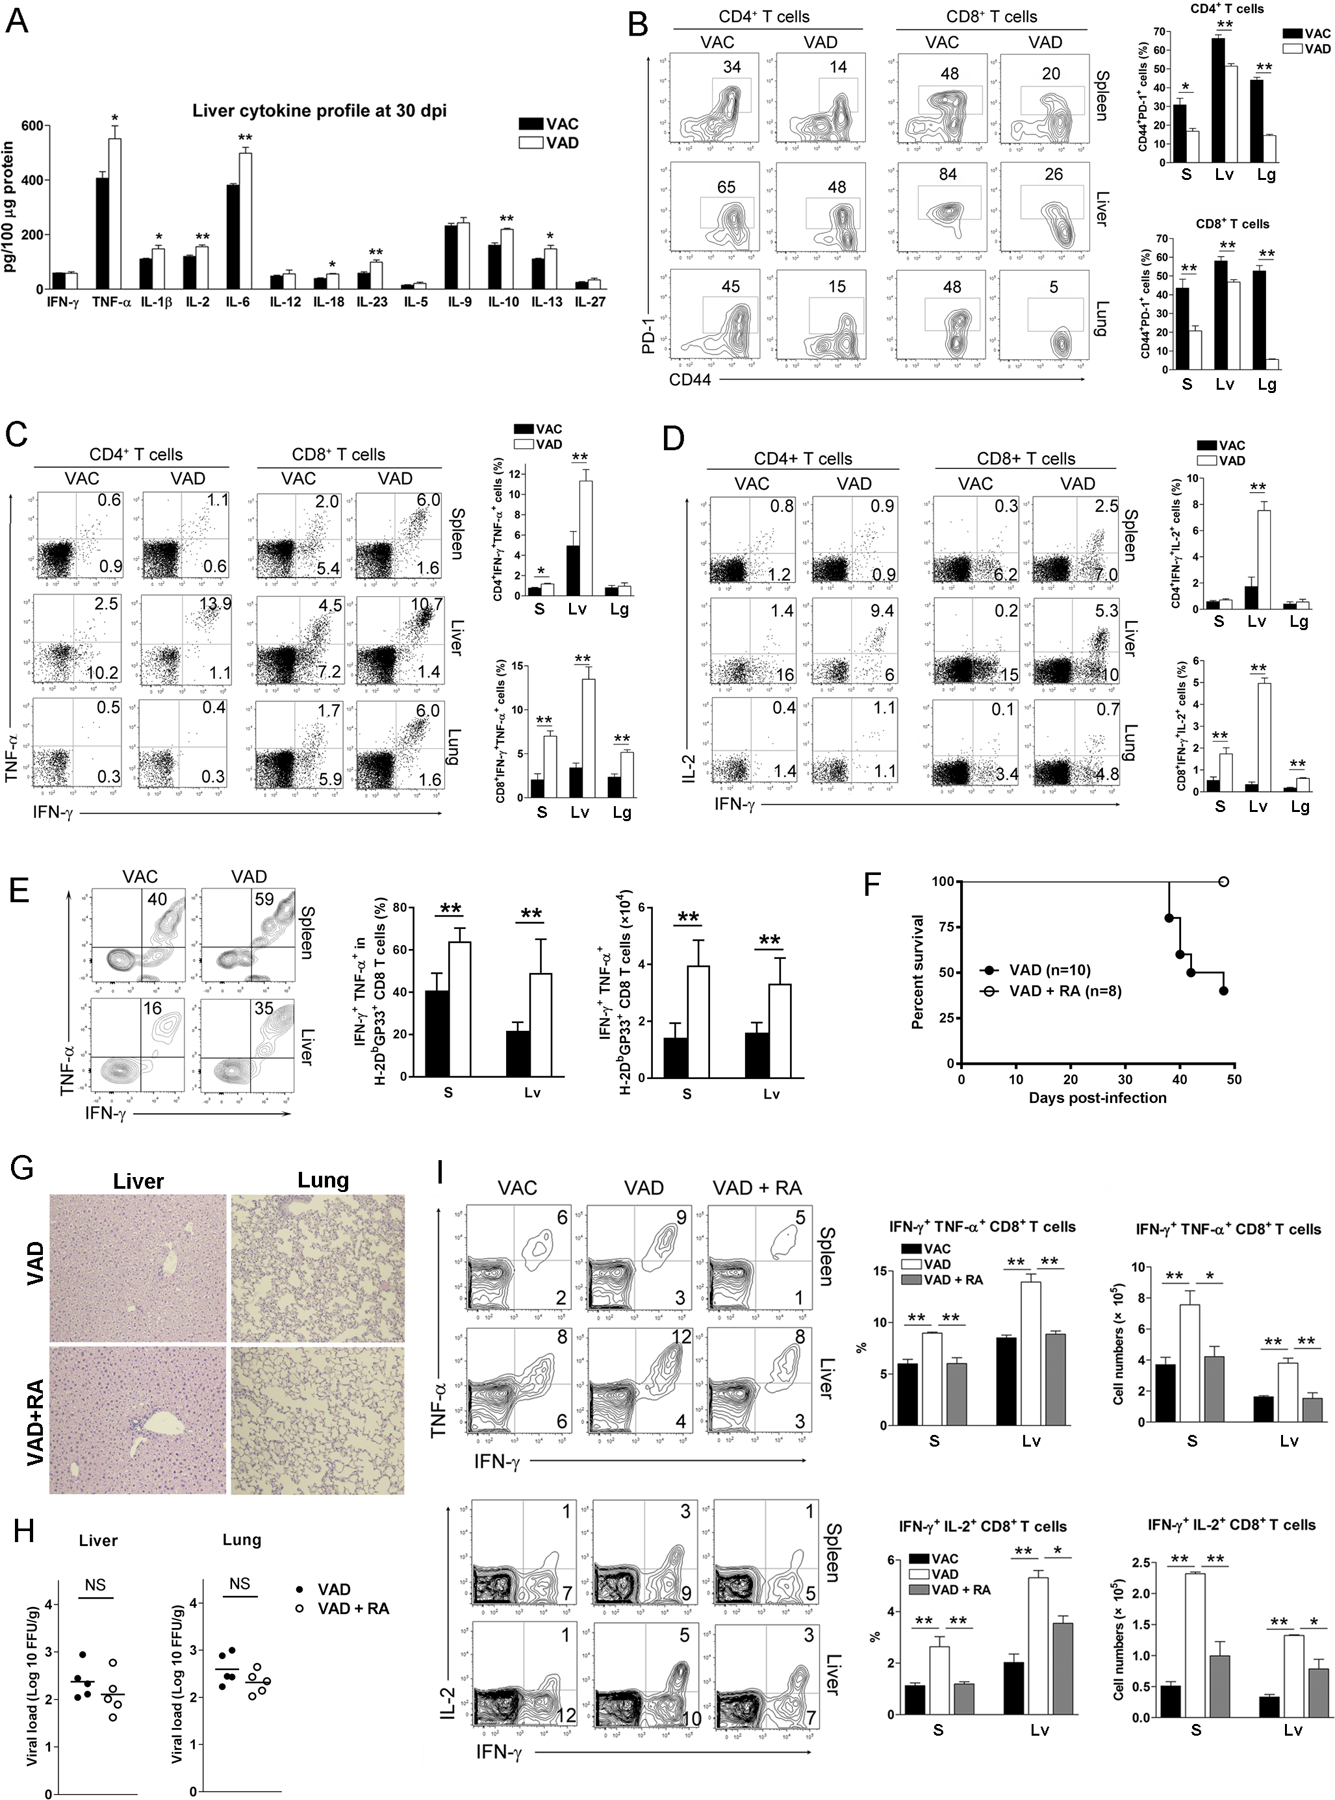
Figure 3. RA treatment restored the hyperactive T cell functions of VAD mice at the contraction stage of viral infection.

VAC and VAD mice were infected with LCMV Cl13 (2×10⁶ FFU). A) Liver cytokine profile at 30 dpi. B-D) Lymphocytes were isolated from the spleen (S), liver (Lv) and lung (Lg), and stimulated with GP33 and GP61 peptides in the presence of BFA for 5 h. Percentages of CD44+PD-1+ T cells, IFN-γ+TNF-α+ T cells and IFN-γ+IL-2+ T cells were analyzed using flow cytometry. E) The H-2Db/GP33 MHC tetramer+ CD8+ T cells were gated first, followed by analysis of IFN-γ and TNF-α expression. F) Infected VAD mice treated with RA (25 μg/daily) starting from 12 dpi through 42 dpi. Animal survival rates were recorded. G) H&E staining and H) viral loads of liver and lungs at 30 dpi. I) Percentages of IFN-γ+TNF-α+ CD8+ T cells and IFN-γ+IL-2+ CD8+ T cells were measured in the spleen and livers at 30 dpi. The data are shown as mean ± SEM of at least six mice per group from a single representative experiment. The experiment was repeated three times independently. A two-tailed Student’s t-test was used to compare the two groups. * P<0.05, ** P<0.01, *** P<0.001, NS, no significance.
