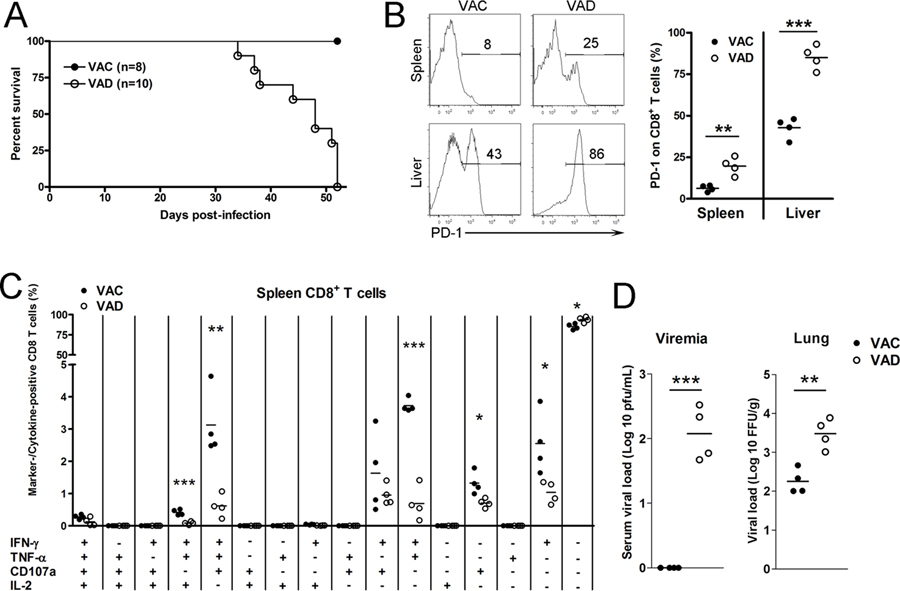
Figure 4. VAD mice exhibited T cell exhaustion and died in the persistent viral infection.
VAC and VAD mice were infected with LCMV Cl13 (2×10⁶ FFU). A) Survival rates. B) Expression of PD-1 on CD8+ T cells. C) Multifunctional CTLs in the spleens. D) Viremia and lung viral loads at 48 dpi. The data are shown as mean ± SEM of four mice per group from a single representative experiment in B-D panels. The experiment was repeated twice independently. A two-tailed Student’s t-test was used to compare the two groups. * P<0.05, ** P<0.01, *** P<0.001.

