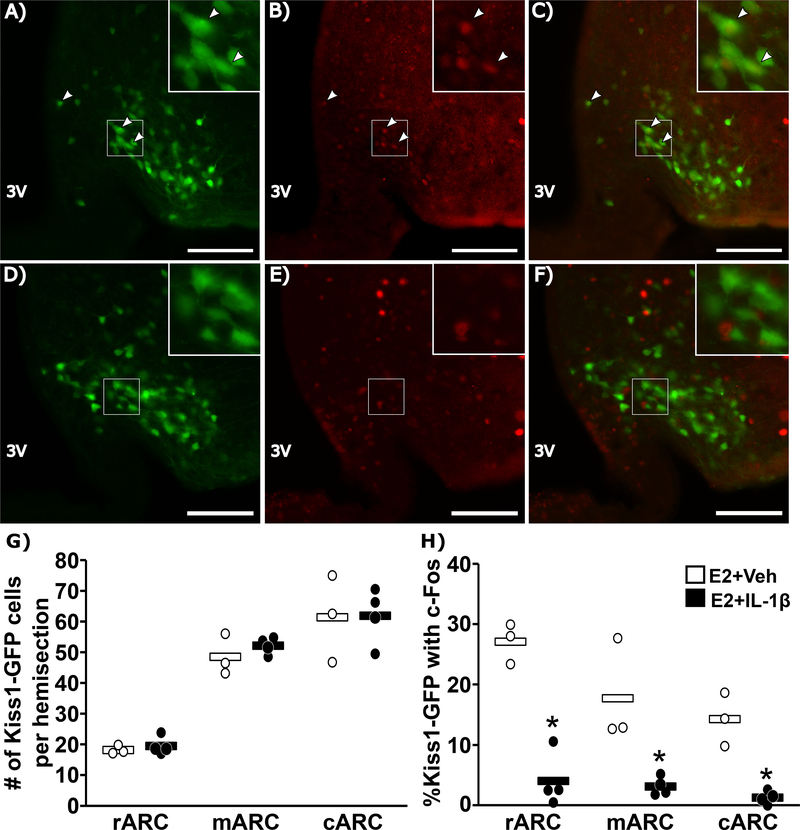
FIG. 4.
Representative photomicrographs of dual-labeled Kiss1hrGFP and c-Fos cells in the ARC of an OVX+E2 female mouse treated with vehicle (A-C) or IL-1β (D-F). GFP-labeled Kiss1 cells (A,D), c-Fos (B, E), and the merged images (C, F) are shown (scale bar = 50μm). White boxes indicate location of zoomed panels. White arrows indicate dual-labeled cells. Panels (G and H) show spread-plots of the data (points) and mean (horizontal bar) of the total number of Kiss1hrGFP cells (G) and percentage of Kiss1hrGFP cells that contain c-Fos (H) following vehicle (open) or IL-1β (closed). n=3–4/group. *, significant effect of IL-1β (p<0.05).

