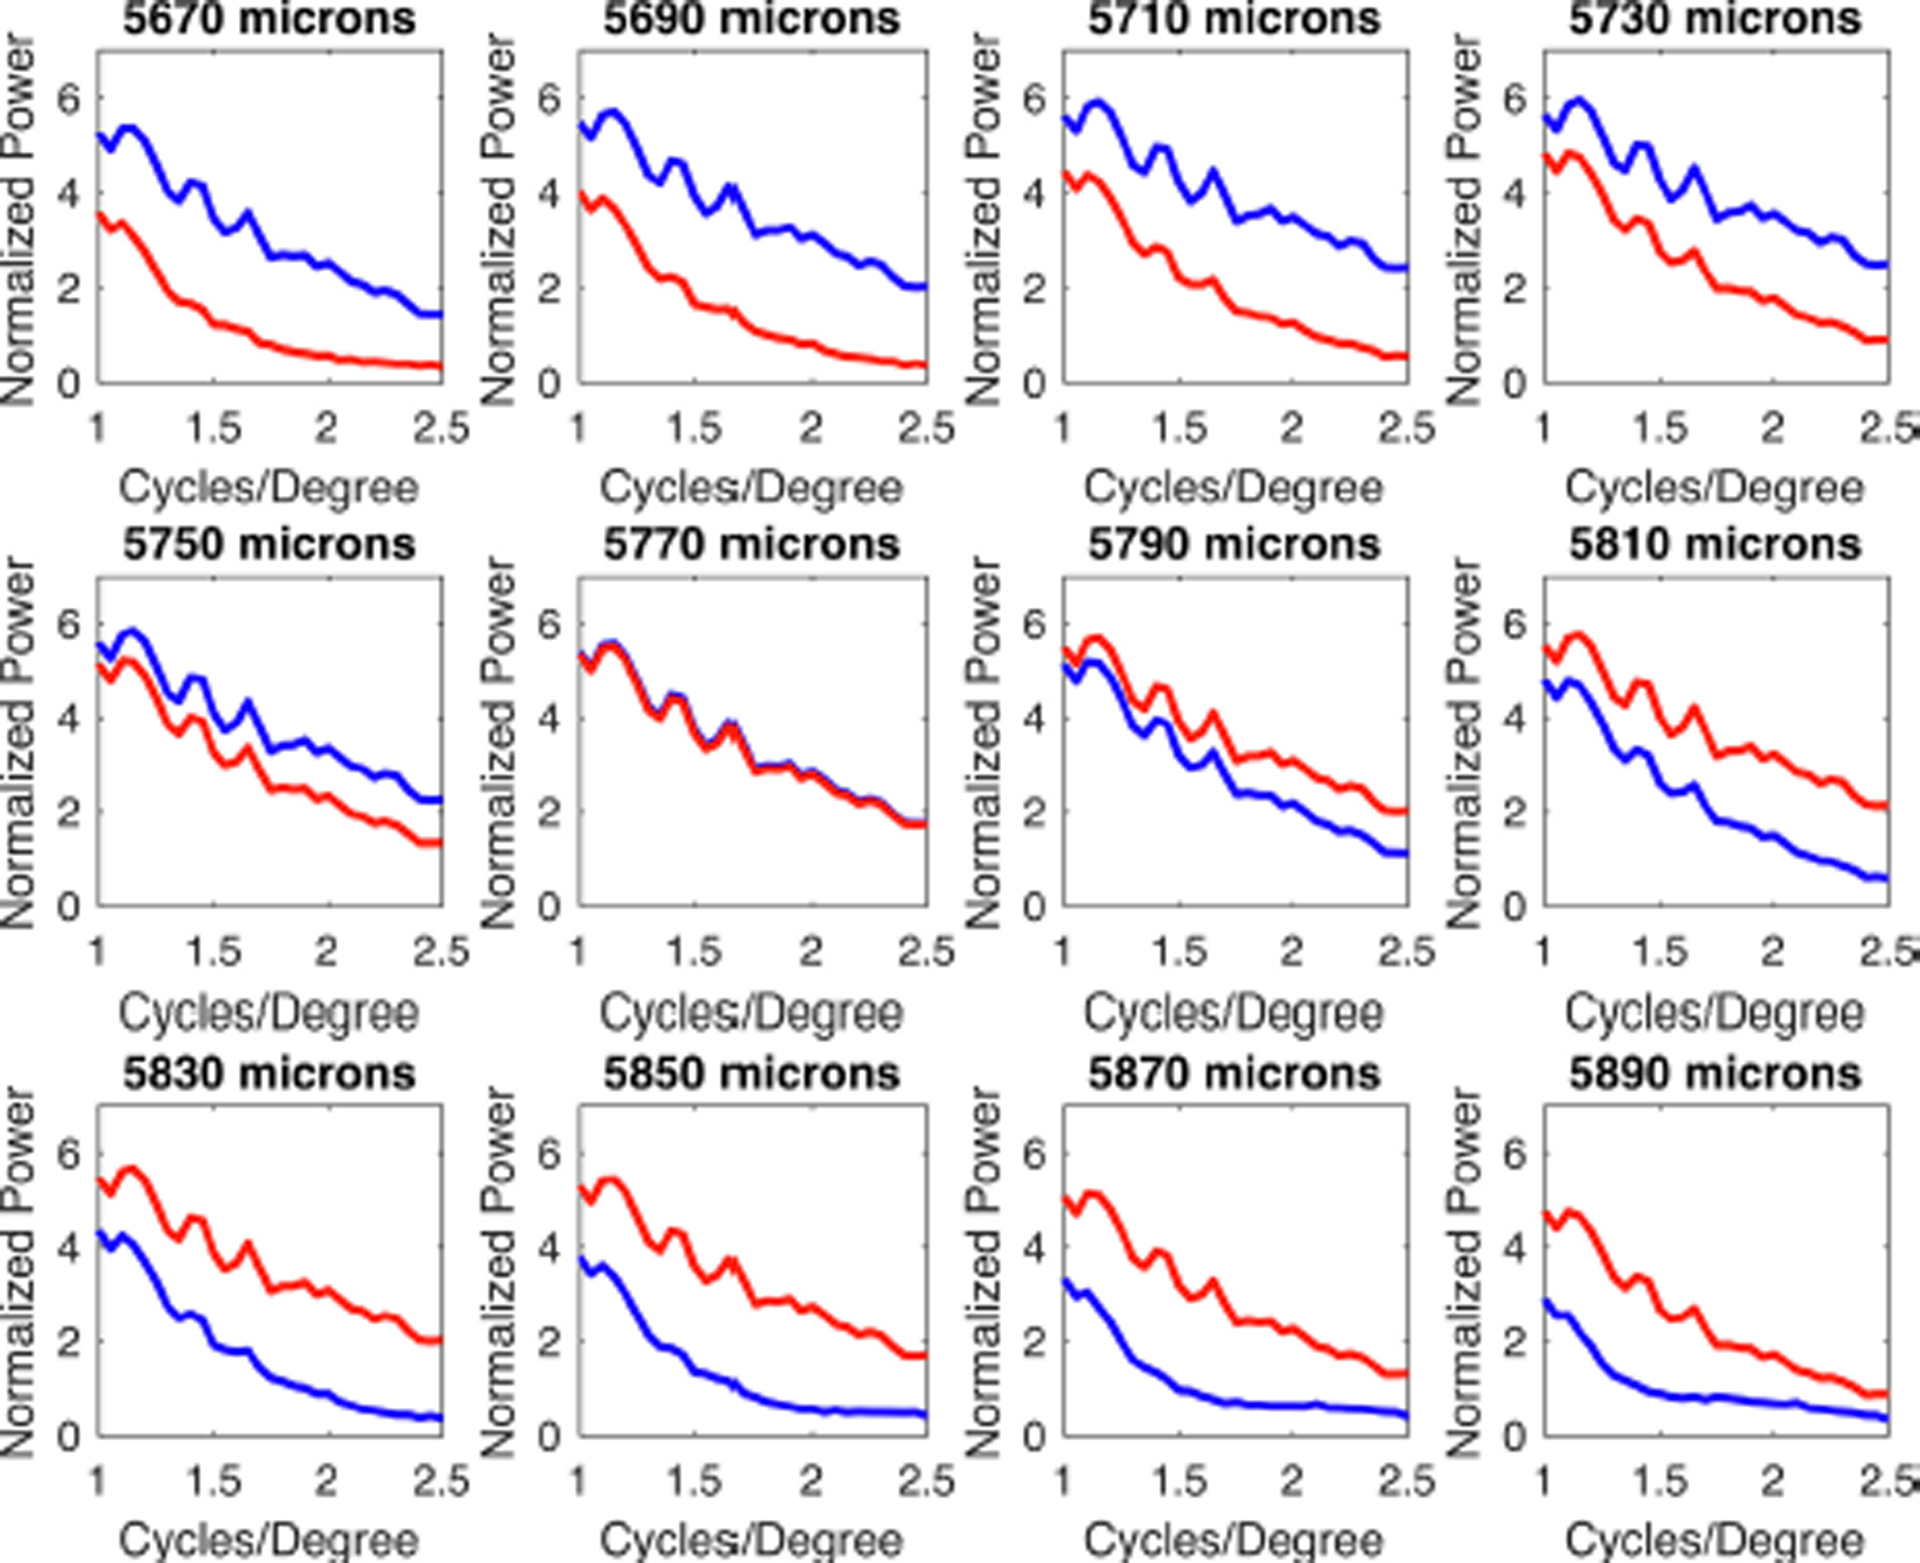
Fig. 11.

Normalized power as a function of spatial frequency as the position of the retina is varied, for the image shown in Fig. 10. Blue lines indicate the SWS cone array and red lines indicate the LWS cone array. At a retinal location of 5770 μm (middle row, second from the left) the spatial frequency distributions are identical for SWS and LWS systems. For hyperopic defocus (panels to the left and above), the SWS cones show significantly more power than the LWS cones at 1 cycle/degree and above. The opposite holds for myopic defocus.
