
Fig. 4.
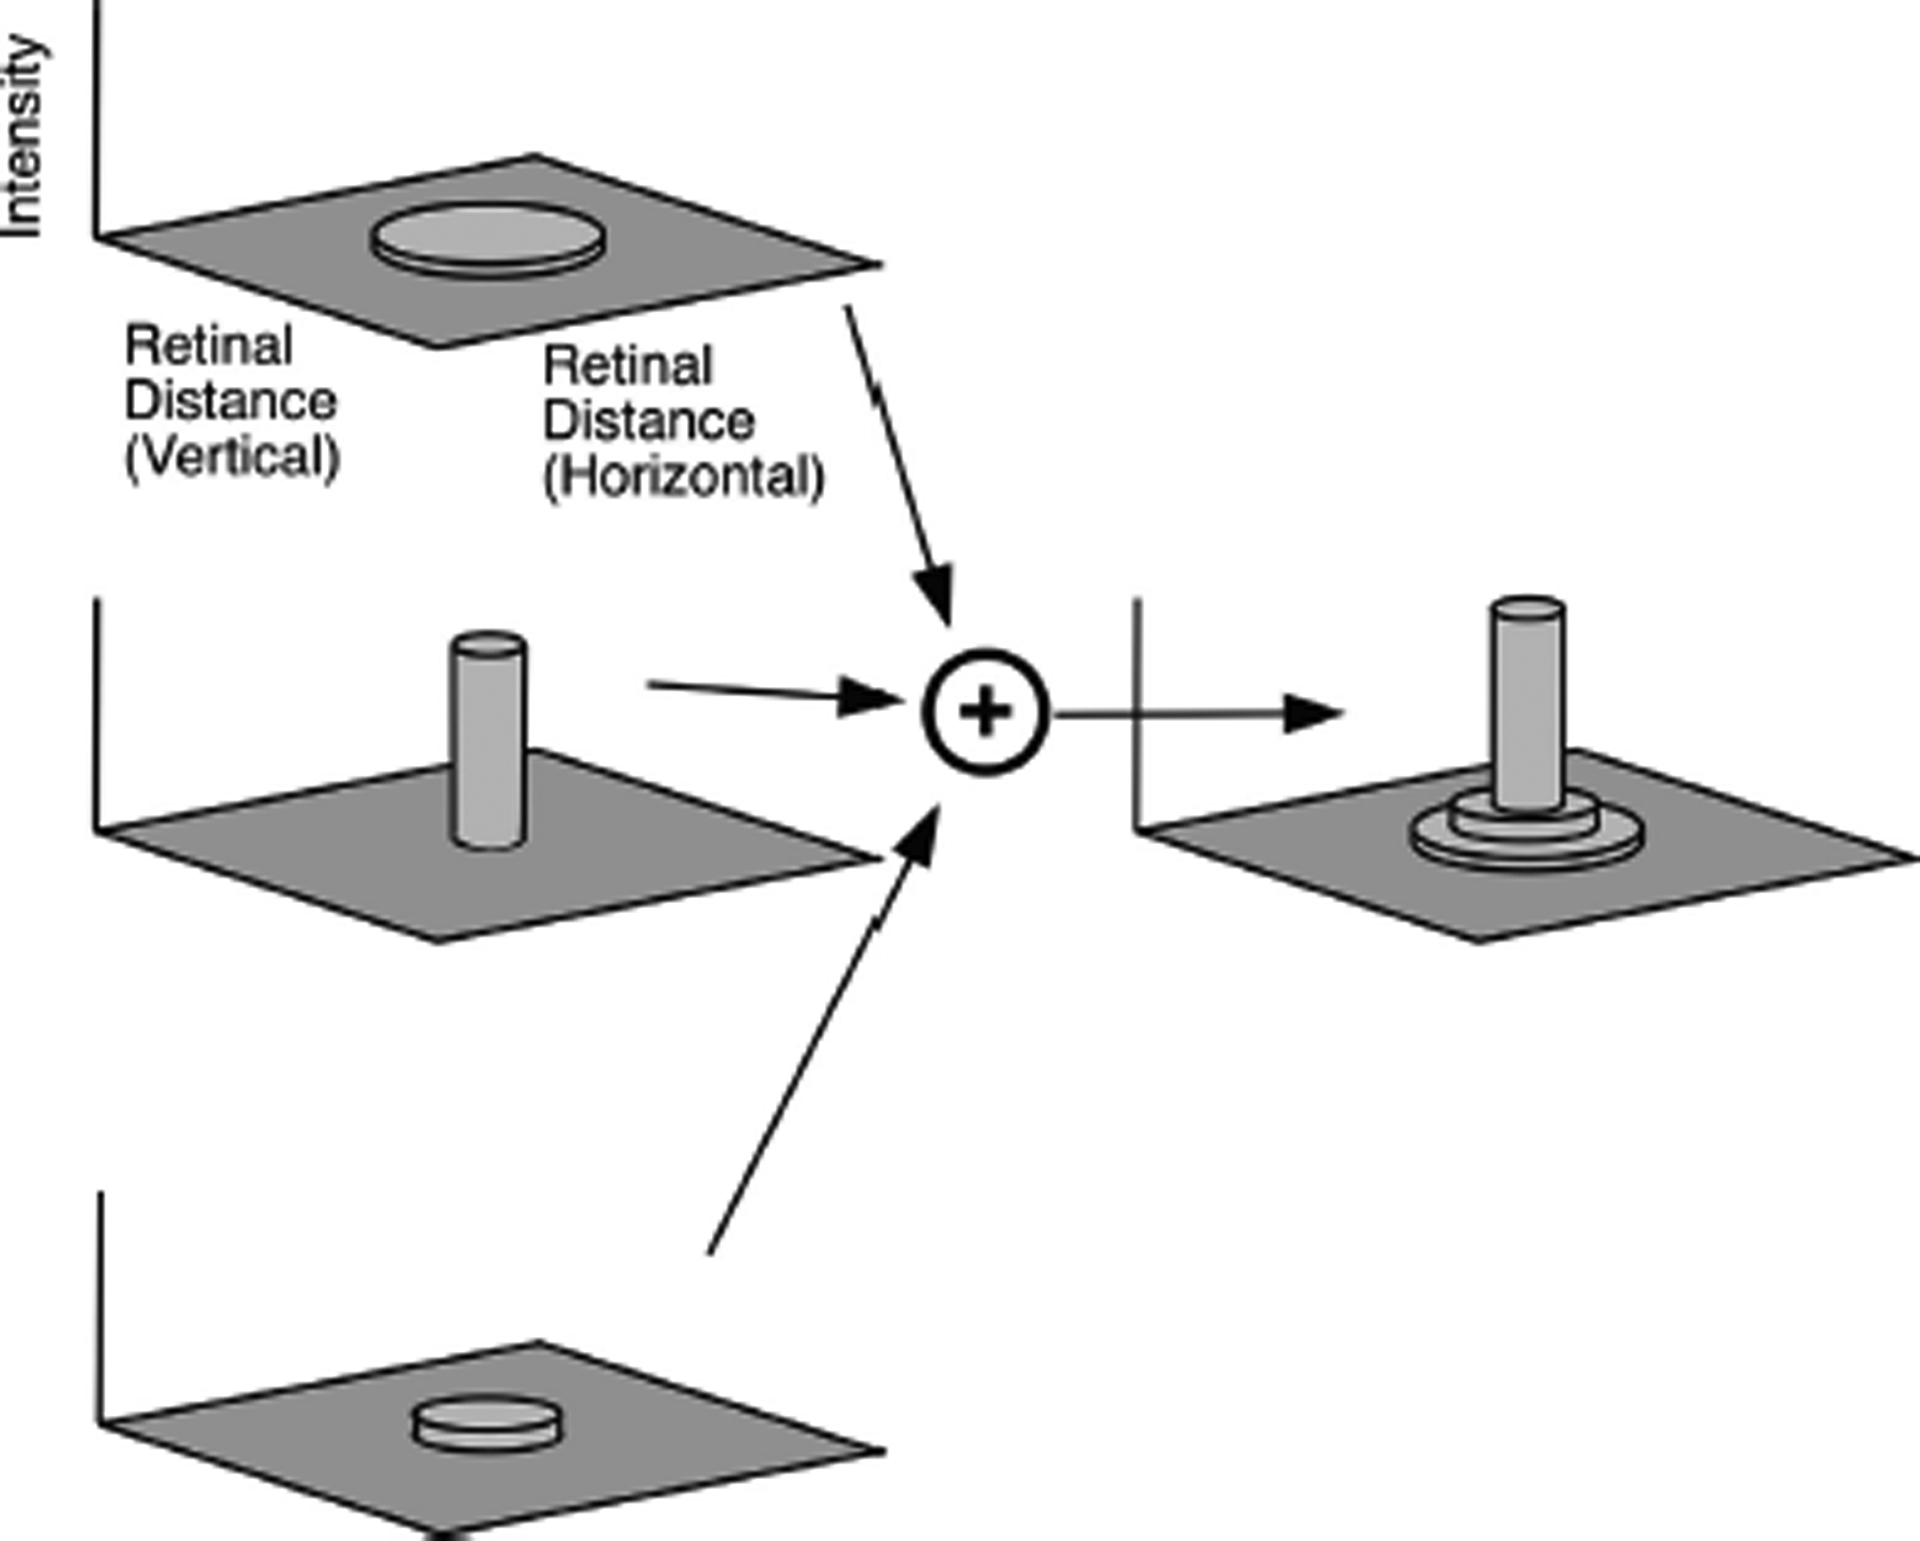
Schematic of how the blur discs for each wavelength are combined to form a single “point spread function.” The graphs to the left represent three blur discs as shown at the bottom of Fig. 3B, but in this case drawn as surface plots where the horizontal and vertical position across the retina in microns lie in the horizontal plane of the graph, and the height of the surface represents the effective intensity. These blur disks at all wavelengths are summed, and provide a composite point spread function as illustrated on the right. Because this simplified schematic uses only three wavelengths and three blur disks, the composite point spread function has a stepped appearance. Summing over all wavelengths would produce a smooth point spread function for the SWS cones and another for the LWS cones. These two point spread functions completely characterize how the SWS and LWS cones respond to any visual pattern with this spectrum of light and retinal location.