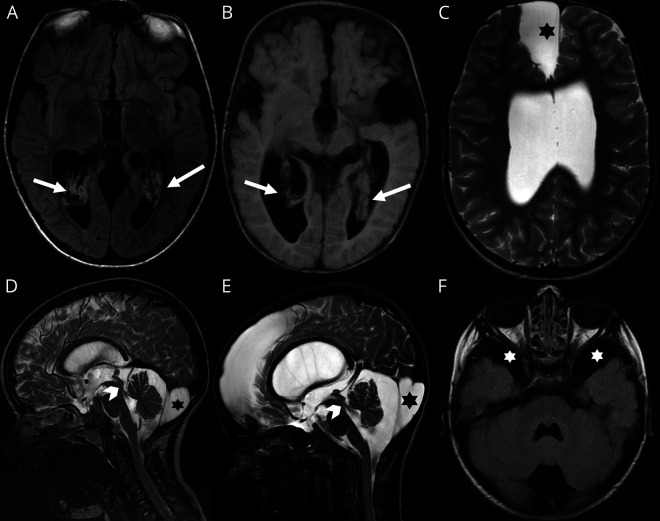
Figure 1. Selection of images from the full study cohort.
Images A, C, and E correspond with patient D; D and F, with patient G; and B, with patient F. Note (A) [axial FLAIR] and (B) [axial T1-WI] on different patients showing choroid plexus hyperplasia (arrows). High-resolution sagittal T2-WI (D, E) confirming CSF flow through the aqueduct of Sylvius (arrowheads) and large retro cerebellar arachnoid cyst in both cases (stars). Further arachnoid cysts were noted in other locations as shown in C (axial T2-WI) and F (axial FLAIR) within the anterior and middle cranial fossae respectively (stars).

